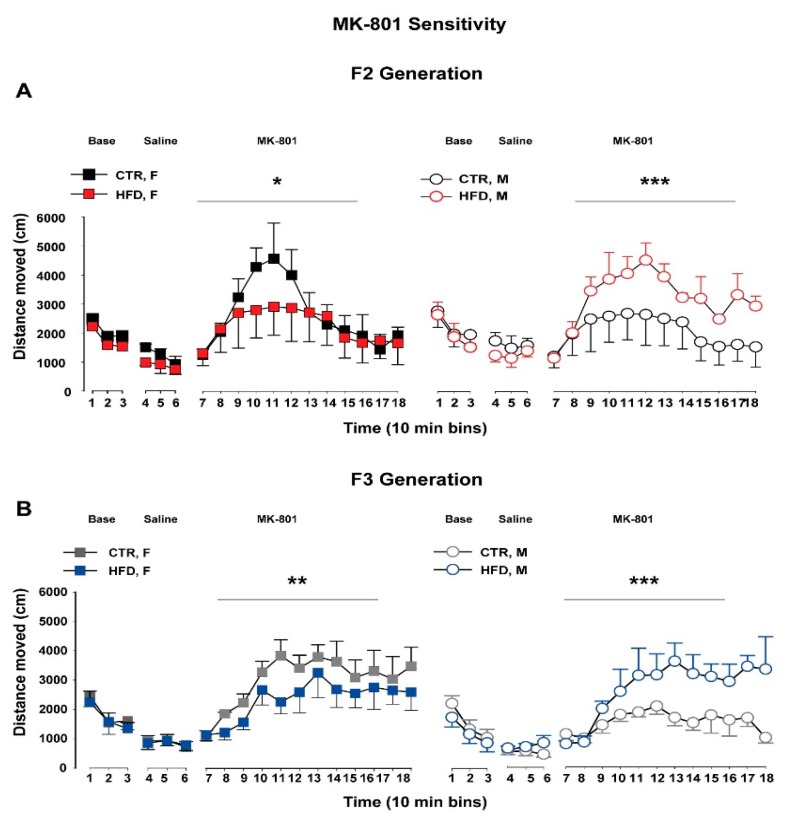
Figure 3.
MK-801 sensitivity test in the F2 and F3 offspring. The line plot shows locomotor activity in the open field expressed as distance traveled (cm) per 10-min bin during baseline, following saline administration and following a systemic MK-801 injection in F2 (A) and F3 (B) offspring. N (F2 CTR) = (4 M, 4 F), N (F2 HFD) = (4 M, 4F), N (F3 CTR) = (5 M, 5 F), N (F3 HFD) = (4 M, 5F). All values are means ± SEM. * p < 0.05; ** p < 0.001; *** p < 0.0001. HFD = high-fat diet, CTR = control diet, F = female, M = male.

