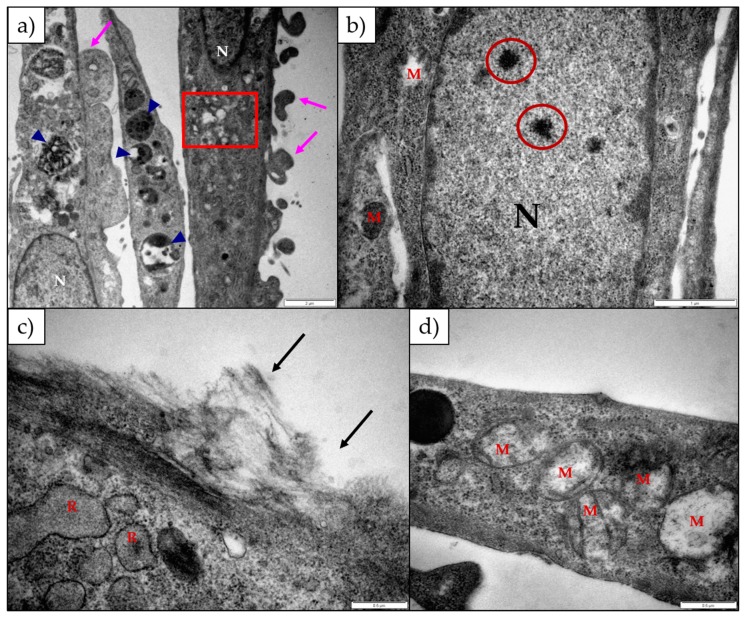
Figure 4.
Electron micrograph of H9c2 cells exposed to (a) 25 µM and (b) 100 µM lanceotoxin B for 24 h; (c) 5 µM lanceotoxin B for 48 h; (d) 100 µM lanceotoxin B for 72 h. The cytoplasm contained autophagic vesicles (blue arrow heads), swollen Golgi complexes (red square) and swollen mitochondria (d). The nuclei were normal, except for some aggregates in the nucleoplasm (red circles). The cells formed plasma membrane blebs (pink arrows) and the cytoskeleton associated with the plasma membrane was disrupted (black arrows). M—Mitochondria; N—Nuclei; R—Rough Endoplasmic Reticulum. The scale bar at the bottom right corner represents 2 µm (a), 1 µm (b) and 0.5 µm (c,d) respectively.

