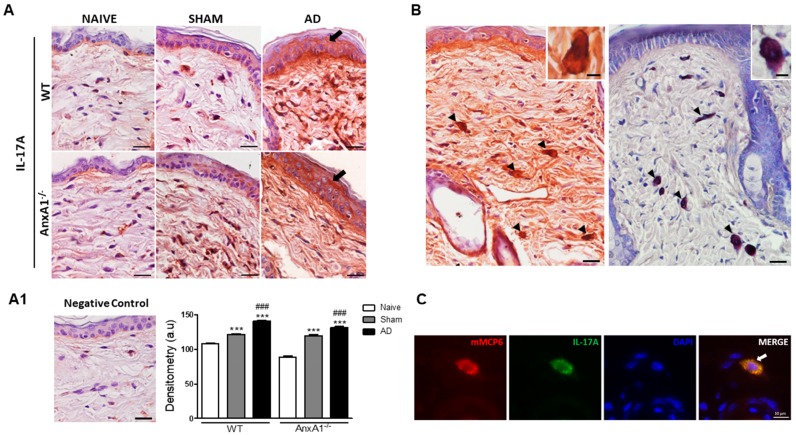
Figure 3.
Expression of IL-17A in the skin. (A): WT and AnxA1-/- AD with intense IL-17A immunoreactivity in the epidermis (arrows) compared to the Naïve and Sham control groups of the respective genotypes. Counterstain: Hematoxylin. Bars: 20 μm. (A1): Absence of immunoreactivity in the negative control of the reaction. IL-17A densitometry in the epidermis. Data represent mean ± SEM of IL-17A expression in arbitrary units (a.u.) (n = 3–5 animals/group). *** p < 0.001 vs. Naïve of the respective genotype; ### p < 0.001 vs. Sham of the respective genotype (Kruskall–Wallis, Dunn post test). (B): IL-17A-positive cells (arrowheads) in the dermis showed similar aspect of metachromatic mast cells (arrows) in the dermis. Insets: detail of IL-17A-positive cells and mast cells. Counterstain: Hematoxylin. Stain: Toluidine blue. Bars: 20 μm; 5 μm (insets). (C): Double-staining for mMCP6 (red) and IL-17A (green) in AnxA1-/- skin. mMCP6 and IL-17A are co-localized in the cytoplasmic granules of mast cells (arrow). DAPI was used as nuclear counterstain. Bar: 10 μm.

