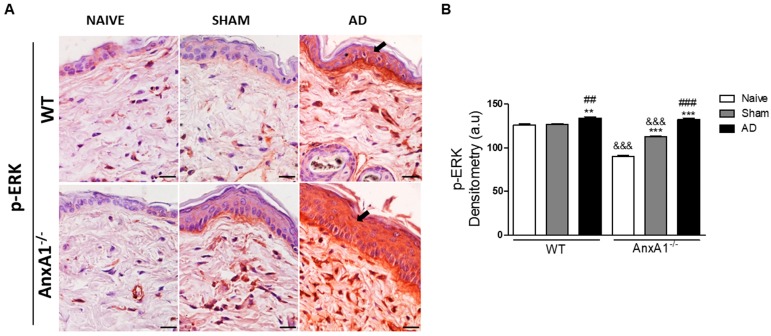
Figure 4.
p-ERK levels in the skin. (A): WT and AnxA1-/- AD with intense p-ERK immunoreactivity in the epidermis (arrows) compared to the Naïve and Sham control groups of the respective genotypes. Bars: 20 μm. (B): Densitometric analysis of p-ERK in the epidermis. Data represent mean ± SEM of p-ERK in arbitrary units (a.u.) (n = 3–5 animals/group). ** p < 0.01, *** p < 0.001 vs. Naïve of respective genotype; ## p < 0.01, ### p < 0.001 vs. Sham of the respective genotype; &&& p < 0.001 vs. corresponding WT groups (Kruskall–Wallis, Dunn post test).

