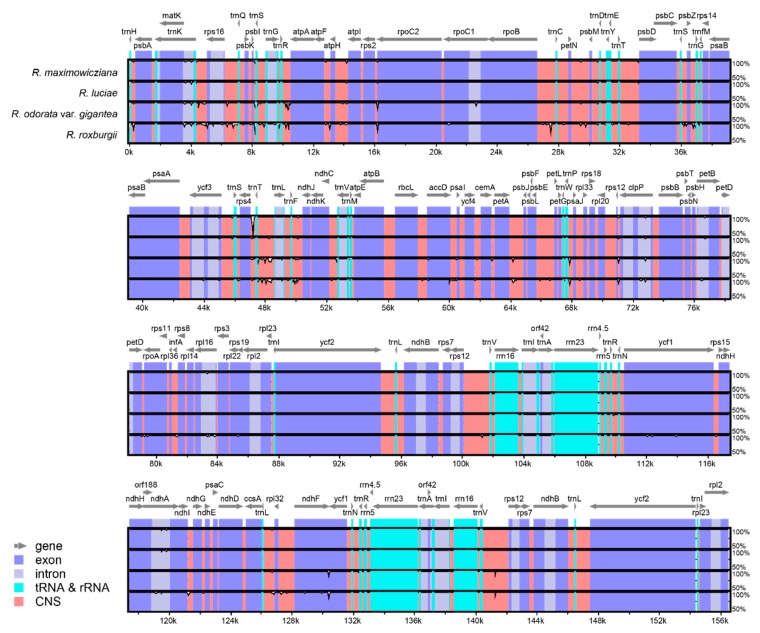
Figure 5.
Visualized alignment of the Rosa chloroplast genome sequences with annotations, using mVISTA. Each horizontal lane shows the graph for the sequence pairwise identity with a R. multiflora chloroplast genome sequence. The x-axis represents the base sequence of the alignment and the y-axis represents the pairwise percent identity within 50–100%. Grey arrows represent the genes and their orientations. Blue boxes represent exon regions and light gray boxes represent intron regions; light blue boxes represent RNA-coding gene regions; red boxes represent non-coding sequence (CNS) regions.

