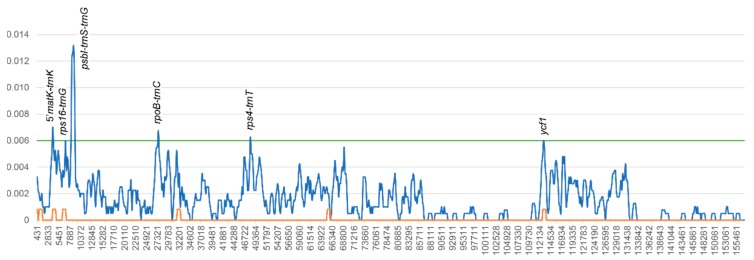
Figure 6.
Nucleotide diversity graphs of Rosa chloroplast genomes. The x-axis represents the base sequence of the alignment, and the y-axis represents Pi value. The blue line indicates the nucleotide diversity of five Rosa chloroplast genomes; the orange line indicates the nucleotide diversity of the Synstylae chloroplast genomes; and the green line indicates the threshold for variation hotspots (Pi threshold = 0.006). Each variation hotspot for Rosa chloroplast genomes is annotated on the graph.

