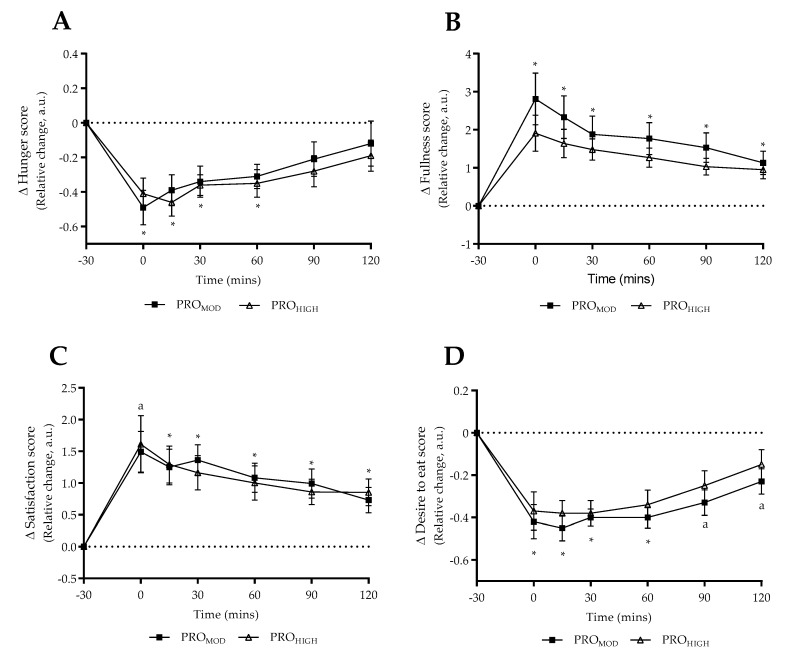
Figure 3.
Questionnaire responses in relation to test meal under laboratory conditions. Data expressed as relative change (post diet, normalised) for both moderate (PROMOD) and high (PROHIGH) protein conditions (mean ± SE). (A) Perception of hunger; (B) Perception of fullness; (C) Perception of satisfaction; (D) Perception of desire to eat. Responses in relation to pre-meal (−30 min) time-point. 0 min denotes immediate completion of test meal. Dashed line provides reference point to pre-meal perceived state. * denotes significant difference compared to pre-meal time-point (p ≤ 0.05) within both dietary conditions. a denotes significant difference compared to pre-meal time-point for PROMOD only (p ≤ 0.048). No differences reported between dietary conditions.

