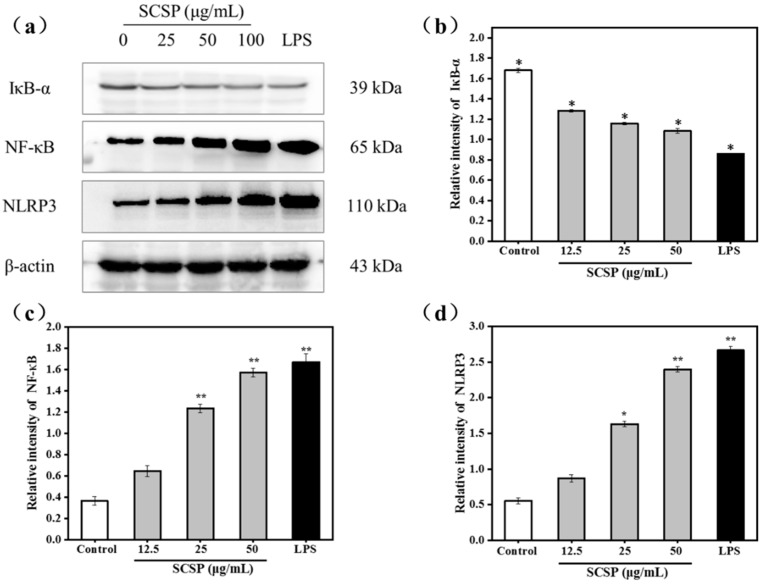
Figure 8.
Effects of SCSP on the expression of IκB-α, NF-κB and NLRP3; (a) Western blot analysis of IκB-α, NF-κB and NLRP3 induced by SCSP in RAW264.7 cells; (b) Effects of SCSP on the expression of IκB-α in RAW264.7 cells; (c) Effects of SCSP on the expression of NF-κB in RAW264.7 cells; (d) Effects of SCSP on the expression of NLRP3 in RAW264.7 cells; The intensity of specific bands was detected by the Quantity One software (version 4.62) to quantify protein expression levels; The grayscale ratio of the specific bands and β-actin were presented as the mean ± SD (n = 3) by the histogram; (*) Results are significantly different from the control (P < 0.05). (**) Results are significantly different from the control (P < 0.01).

