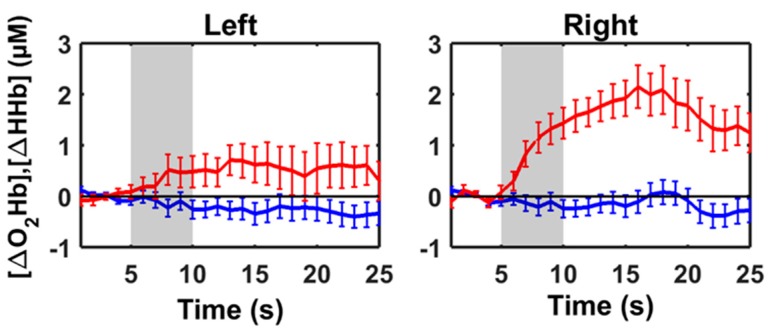
Figure 6.
Group-averaged hemodynamic response and standard deviation of eight sheep for the left and right hemisphere. The plots (left and right) display the group-averaged oxygenated haemoglobin change [ΔO2Hb] (red lines) and deoxygenated haemoglobin change [ΔHHb] (blue lines), in μM, with respect to the baseline (0 s−5 s) of the left and right hemispheres. In every plot, the auditory stimulus (5 s−10 s) is marked as the grey area, followed by the anticipation phase (10 s−25 s). The horizontal black line in every sub-figure indicates the zero values.

