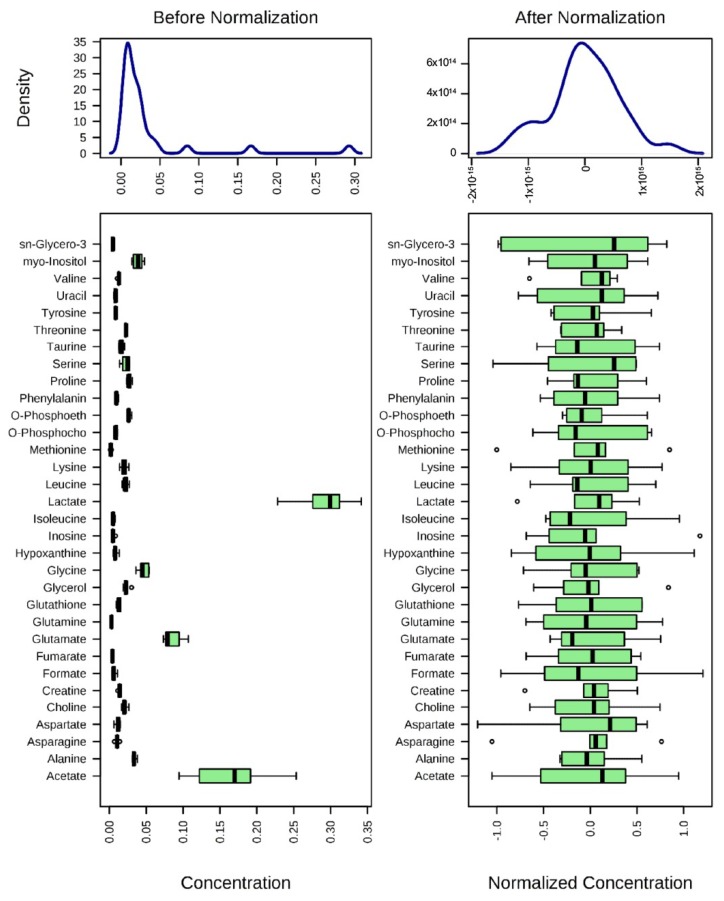
Figure 3.
Normalization of 1H-NMR aquired metabolite concentrations. The concentrations of metabolites were normalized by log-transformation followed by Pareto scaling (mean-centered and divided by the square root of the standard deviation of each variable). Changes of metabolites are represented as ratios of control metabolites.

