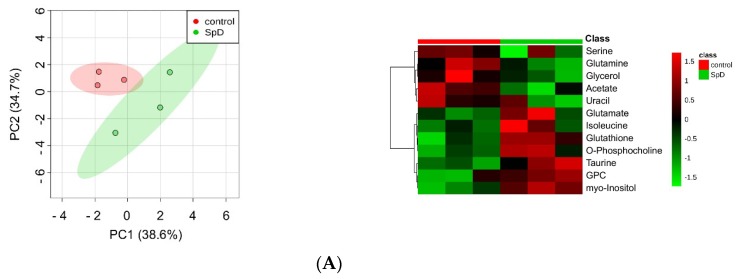
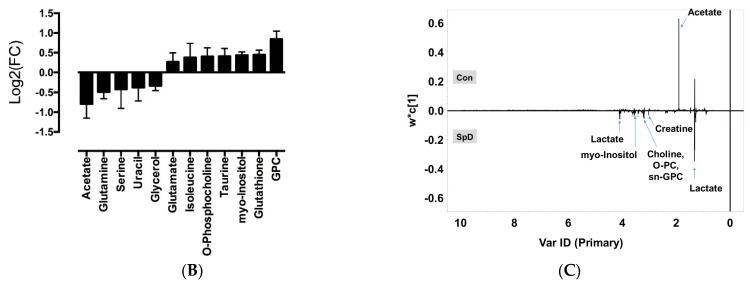
Figure 5.
1H-NMR metabolomics for SpD-treated AC16 cells. (A) Principal component analysis (PCA) indicated that metabolites from the SpD-treated (10 μM, 24 h) group were significantly different from those in the control group; (B) Heat-map analysis of metabolites with variable importance in projection (VIP) score > 1.0. The logarithmic fold changes are shown below. GPC, sn-glycero-3-phosphocholine; (C) The loading plots from orthogonal partial least-squares discriminant analysis (OPLS-DA) for SpD metabolites compared with the control group.


