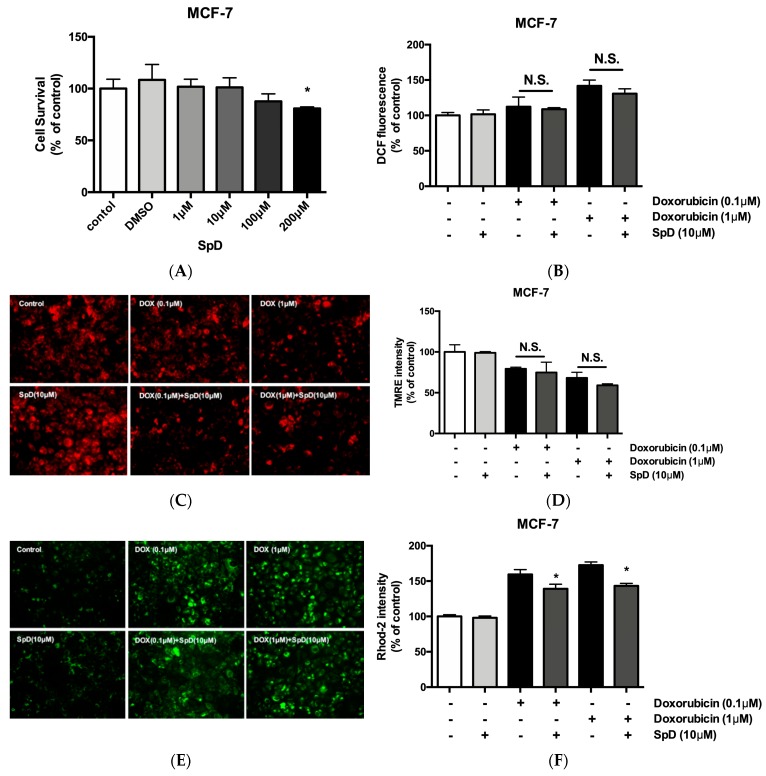
Figure 10.
SpD did not inhibit the cytotoxicity of doxorubicin. (A) SpD induced MCF-7 cell death at 100–200 μM. * p < 0.05 compared with the untreated control; (B) The co-treatment of SpD and doxorubicin showed similar levels of ROS compared with the doxorubicin alone group; (C) Mitochondrial membrane potential was visualized using TMRE staining in SpD/doxorubicin-treated MCF-7 cells; (D) The TMRE intensity measured by fluorometry is shown; (E) Mitochondrial Ca2+ level is indicated using rhod-2 dye in SpD/doxorubicin-treated MCF-7 cells; (F) The rhod-2 intensity was measured by fluorometry. * p < 0.05 compared with doxorubicin treated groups without SpD. ROS = reactive oxygen species.

