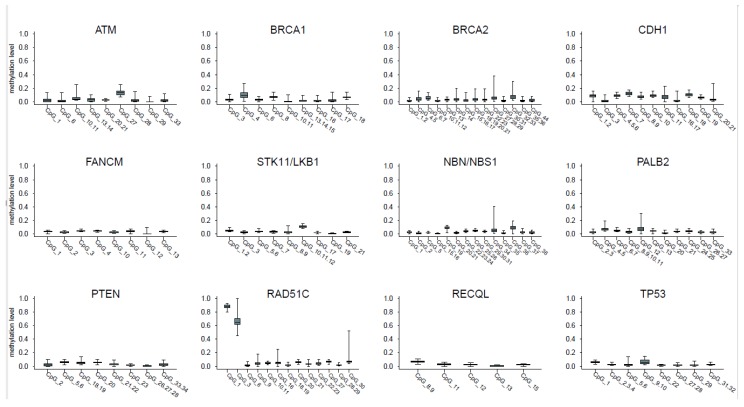
Figure 1.
distribution of blood methylation levels of selected CpGs within each promoter. Each panel reports the box plot of the blood methylation levels at the selected CpGs within a single promoter. The boxes indicate the 25th and 75th percentiles of the distribution. The horizontal line inside the box indicates the median and the whiskers indicate the extreme (max and min) values of the blood methylation levels.

