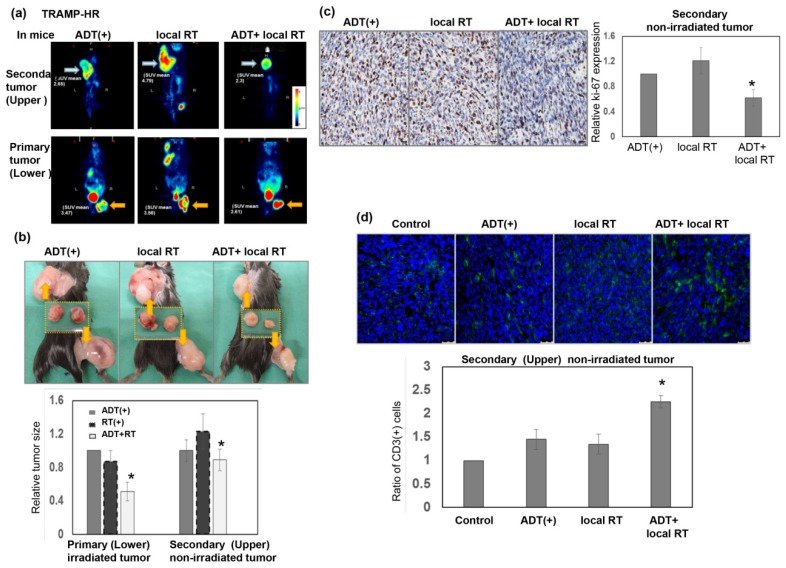
Figure 5.
Role of RT in the response of metastatic CRPC to ADT. (a) Representative PET images from the tumor-bearing mice 24 h after three times 8 Gy to the right thigh tumor only (orange arrow: Primary irradiated tumor; blue arrow: Secondary non-irradiated tumor). (b) Representative images from the tumor-bearing mice 7 days after three times 8 Gy to the right thigh tumor only (right thigh tumor: Primary irradiated tumor; upper back tumor: Secondary non-irradiated tumor). The y axis represents the relative ratio, normalized to the tumor size of primary CRPC tumors in sham-irradiated mice treated with ADT (* p < 0.05). (c) Expression levels of Ki-67 of the secondary non-irradiated tumors were evaluated by IHC analysis. Representative images (Scale bars: 20 μm) and quantitative data are shown. The y axis represents the relative ratio, normalized to the value of secondary non-irradiated tumors in enzalutamide-treated mice (* p < 0.05). (d) The extent of TILs of the secondary non-irradiated tumors was examined by immunofluorescence analysis using tumor specimens that underwent CD3 staining in mice bearing ectopic tumors. Scale bars: 50 μm. The quantification was the calculation of the value of the cell numbers positive for CD3 divided by the total cell number. The y axis represents the ratio normalized by the value under control conditions.

