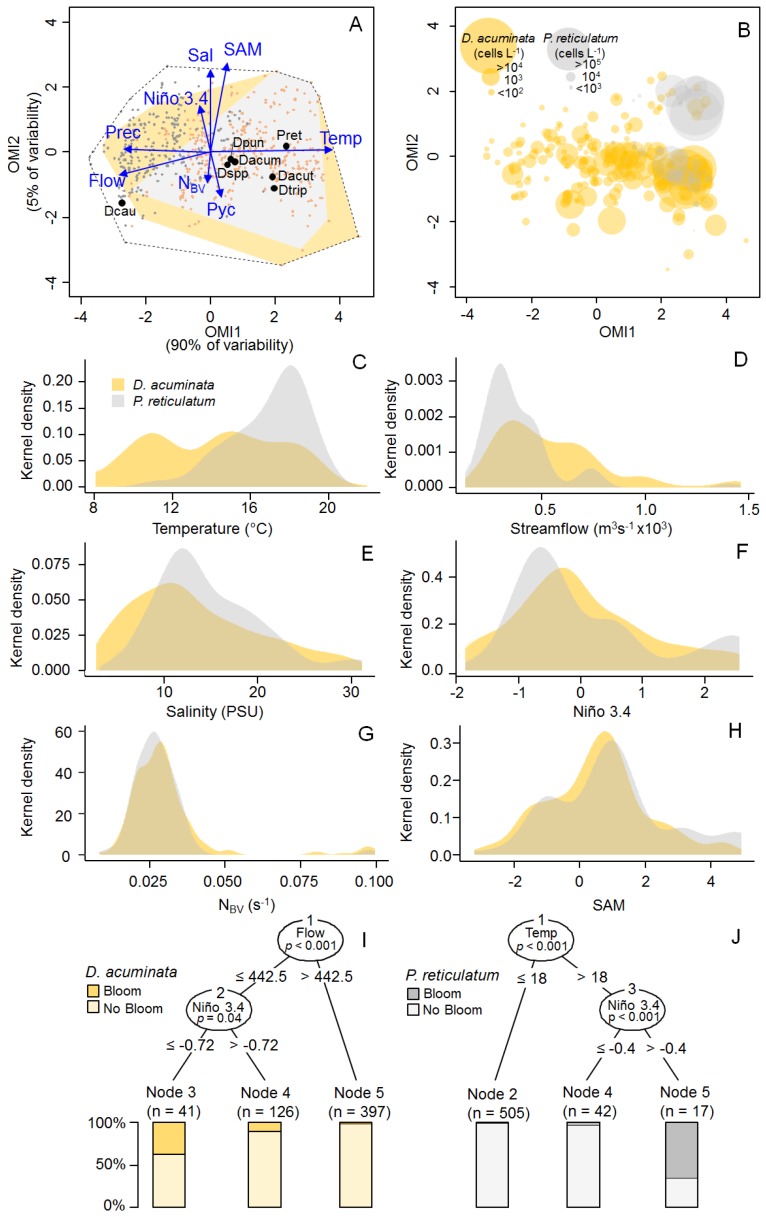
Figure 3.
(A) Outlying Mean Index (OMI) analysis of the five Dinophysis species and P. reticulatum for the entire sampling period in the inner portion of the fjord (sampling stations 4 to 9). Blue vectors show relationship with the physical and meteorological variables. Samples from the spring–summer and autumn–winter periods are depicted in orange and grey, respectively. The dashed line delimitates the realized environmental space (i.e., sampling domain) whereas the yellow and grey polygons represent the realized niches of D. acuminata and P. reticulatum, respectively. The black dots represent the mean habitat condition used by the different species (i.e., species’ niche positions). Dacum = D. acuminata, Dacut = D. acuta, Dcau = D. caudata, Dpun = D. puncata, Dtrip = D. tripos, Pret = P. reticulatum; Flow = Puelo River’s Streamflow, Niño 3.4 = Niño 3.4 index, NBV = Brunt–Väisälä buoyancy frequency, Pyc = depth of the pycnocline, Prec = precipitation, Sal = subsurface salinity, Temp = subsurface water temperature, SAM = Marshall Southern Annular Mode index. (B) Distribution of cell densities of D. acuminata and P. reticulatum in the OMI multivariate space. (C–H) Kernel density estimation (KDE) plots showing the frequency of occurrence (presence/absence) of D. acuminata and P. reticulatum related to different environmental variables. (I,J) Conditional inference trees showing main variables associated with blooms of D. acuminata (I) and P. reticulatum (J).

