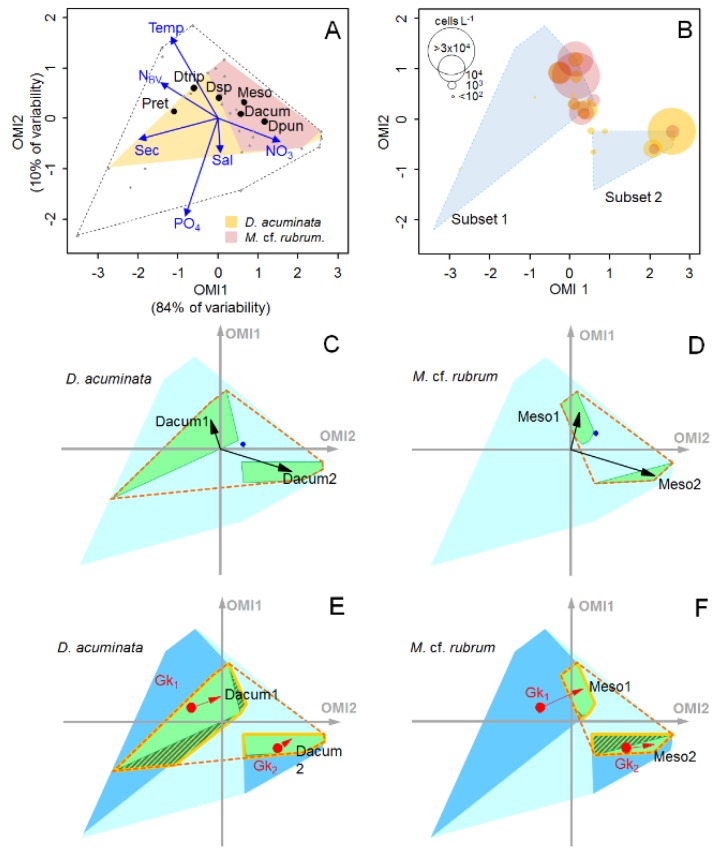
Figure 6.
(A) OMI analysis for the summer–spring period 2008/2009 in the sampling station 8. The blue vectors show relationship with the physical and meteorological variables (see Figure 3 for meaning of labels). The black dashed line delimitates the realized environmental space (i.e., sampling domain) whereas the yellow and pink polygons represent the realize niches of D. acuminata and M. cf. rubrum, respectively. The black dots represent the mean habitat condition used by the different species (i.e., species’ niche positions). Dacum = D. acuminata, Dpun = D. puncata, Dtrip = D. tripos, Dsp = Dinophysis sp., Meso = Mesodinium cf. rubrum, Pret = P. reticulatum. (B) Distribution of cell densities of D. acuminata and M. cf. rubrum in the OMI multivariate space. Blue polygons represent the two subsets. (C, E) D. acuminata and (D, F) M. cf. rubrum subniches’ dynamics (see Figure 5 for meaning of dots, arrows and polygons).

