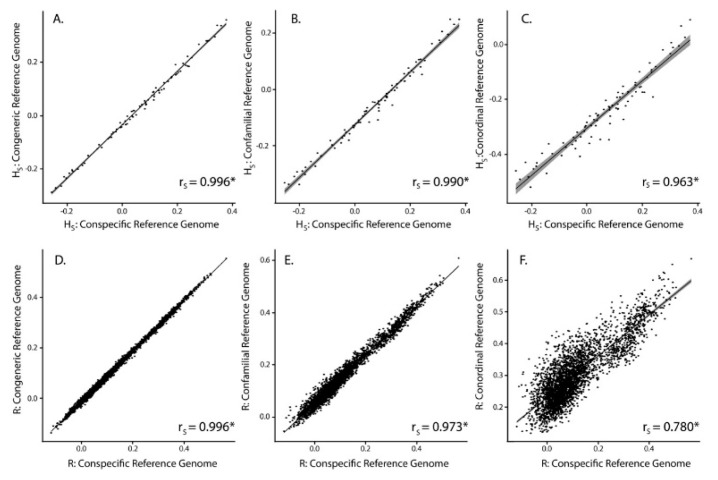
Figure 3.
Scatterplots showing individual point estimates of HS (A–C) and pairwise R estimates (D–F) using GBS reads mapped to different reference genomes. Self-relatedness estimates were not used in this analysis. Trend line in black, with 95% confidence intervals surrounding the trend line in gray. Spearman’s correlation coefficient (rS) provided in the lower right corner of each scatterplot. * indicates significance p < 0.001.

