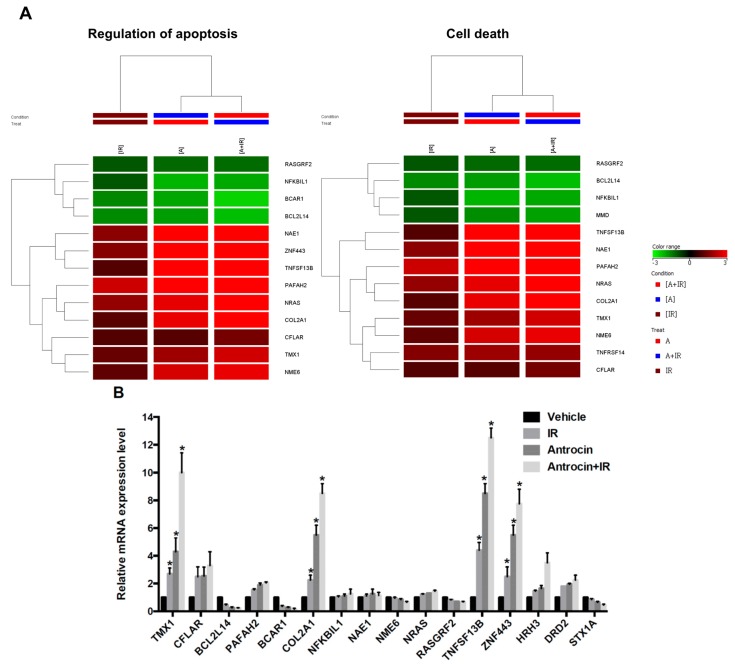
Figure 3.
Gene expression profiles in PCa cells treated with IR and antrocin. After PC3-KD cells were treated with antrocin (100 μM) and/or IR (2 Gy), or co-treatment with IR and antrocin, a microarray analysis was performed. (A) Heatmap analysis showed the gene expression changes. Analysis of apoptosis-related genes are shown. (B) Apoptosis-related genes that were differentially expressed between treated and untreated groups were validated through qRT-PCR. Average fold-changes are presented. Statistical significance was evaluated by two-way ANOVA (* p < 0.01).

