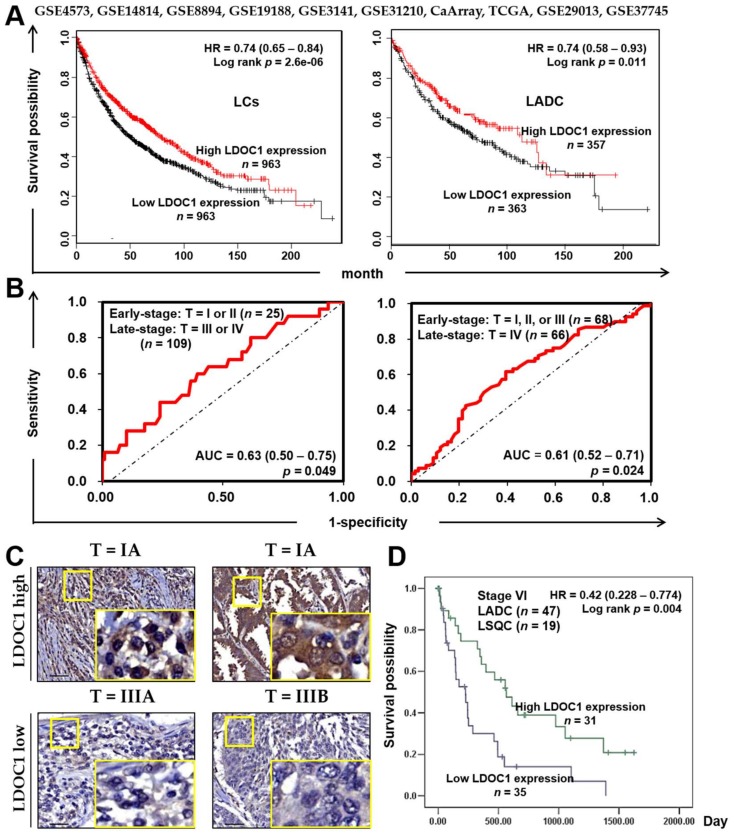
Figure 2.
Prognosis analysis according to mRNA and protein expression of LDOC1 in lung cancer specimens. (A) Online Kaplan–Meier survival analysis (http://kmplot.com/analysis) of ten integrated published microarray datasets from lung cancer (LC, left) or LADC (right) specimens according to high or low LDOC1 mRNA expression levels (LC, p = 2.6 × 10⁻⁶; LADC, p = 0.011; log-rank test). (B) Receiver operating characteristic (ROC) curves for LDOC1 protein expression and T stage of lung cancer specimens in a TMA. Specimens were classified into early-stage (T = I or II (left); T = I, II, or III (right)) and late-stage (T = III or IV (left); T = IV (right)). The areas under the Receiver Operating Characteristic (ROC) curve (AUC) with 95% confidence interval (CI) are indicated. (Left, p = 0.049; right, p = 0.024; t-test). (C) Representative immunohistochemistry images indicate high LDOC1 expression in stage IA but low LDOC1 expression in stage IIIA and IIIB lung cancer specimens. Small and large yellow frames indicate the original and magnified areas, respectively. Scale Bar, 50 μm. (D) Kaplan–Meier survival analysis of patients with lung cancer with stage IV specimens (n = 66, including LADC (n = 47) and lung squamous cell carcinoma (n = 19)) in a TMA according to high or low LDOC1 expression levels determined by IHC (p = 0.004; log-rank test).

