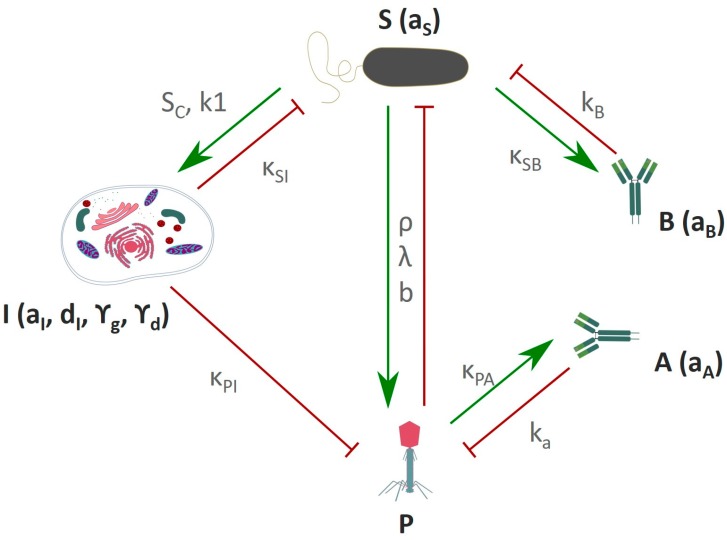
Figure 4.
Schematic representation of the immune response against phages and bacteria. P–Phage, S–bacteria, I–innate immunity, A–adaptive immune response to phage, B–adaptive immune response to bacteria. Green arrows represent a stimulatory effect, red arrows represent an inhibitory effect. Variables and parameters used in these models are described in Tables S1 and S2. Adapted from Hodyra-Stefaniak et al. [26].

