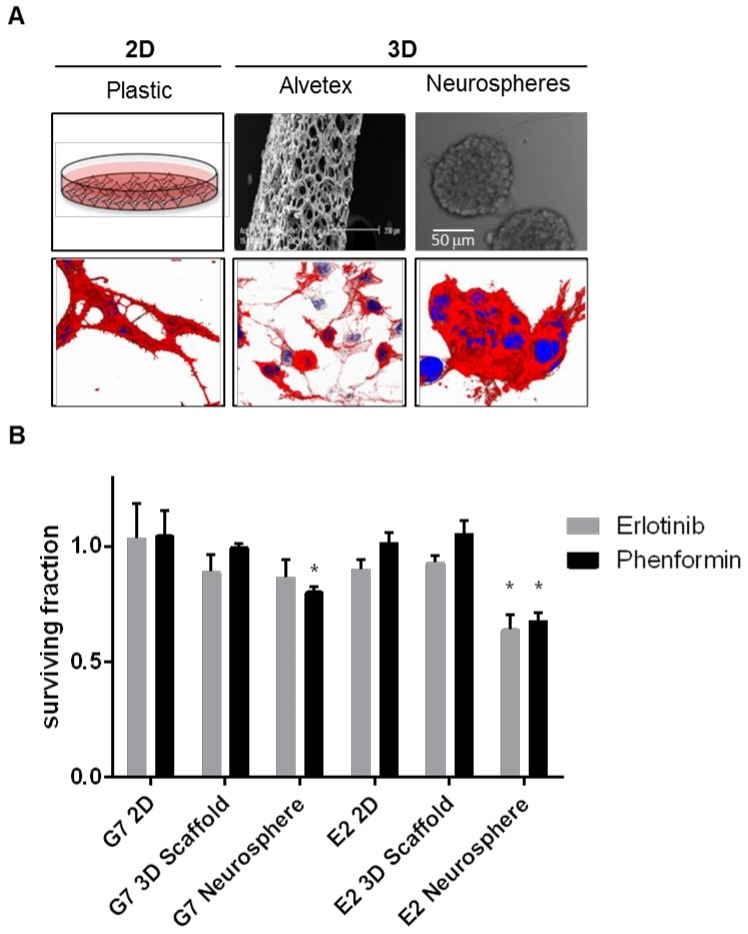
Figure 2.
Comparison of erlotinib and phenformin activity on three different cell culture systems. (A) Schematic representation (upper panels) and 3D reconstructions of immunofluorescent images (lower panels) of cells stained for F-actin (red) and nuclei (DAPI, blue) of three cell culture systems: 2D growth on plastic plates (left images, 63× magnification); 3D scaffold growth using 3D-Alvetex system (middle images 63× magnification); and 3D neurospheres (right images, 63× magnification, zoom 2×). 2D plastic and 3D scaffolds were previously coated with diluted Matrigel as described in section Matrigel-coating for 2D growth. (B) Bar charts representing surviving fraction of cells relative to control grown on different culture systems. G7 and E2 patient-derived GBM cell lines treated with vehicle (DMSO, control), phenformin (10 µM), or erlotinib (1 µM). Drug-treated cells were normalised to vehicle (mean ± SD, of three independent experiments). * p < 0.05, relative to DMSO control of their respective culture system.

