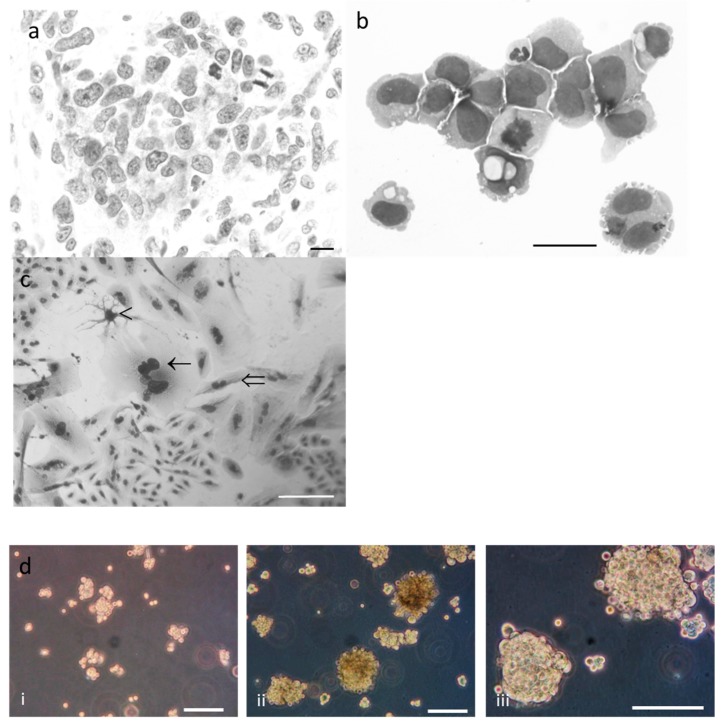
Figure 2.
Morphological and phenotypic analysis of (a) the biopsy of the original tumor: HES staining shows the heterogeneity of the tumor cells and mitosis. Scale bar = 100 µm (b) cerebro-spinal fluid (CSF): May Grunwald Giemsa (MGG) staining shows mitosis and a giant cell. Scale bar = 25 µm (c) R2J cells in 2D culture: MGG staining shows giant cells (←), fibroblastic-like cells (⇐) and glial-like cells (<). Scale bar = 100 µm (d) R2J forming spheres in a medium without serum, 7 days (i) and 25 days (ii: ×100 and iii: ×200) after the seeding. Pictures are representative of more than four independent experiments. Scale bar = 100 µm.

