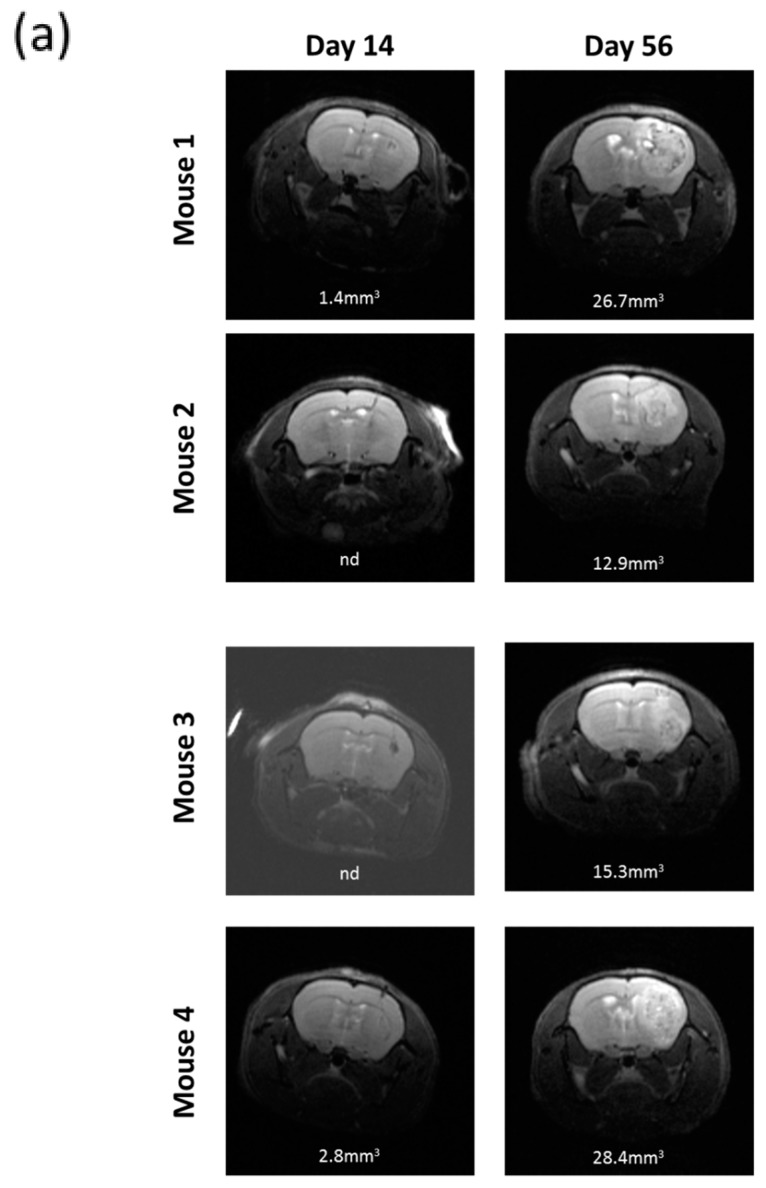
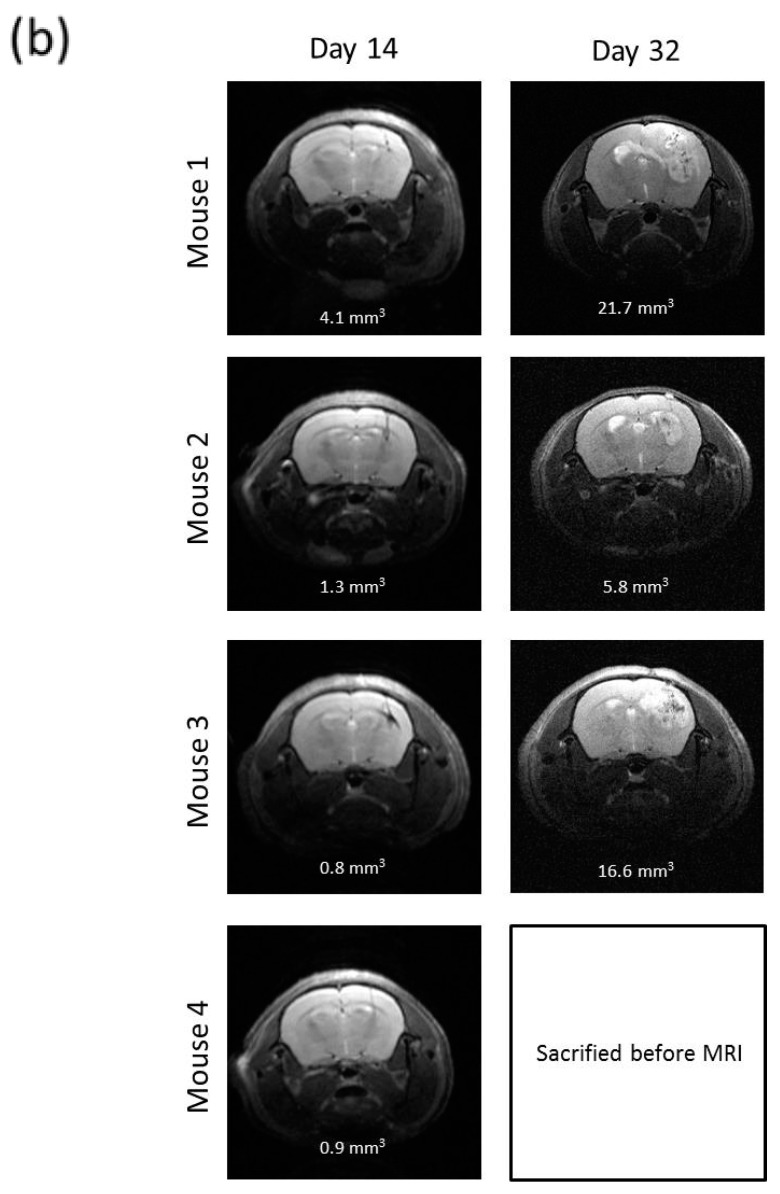
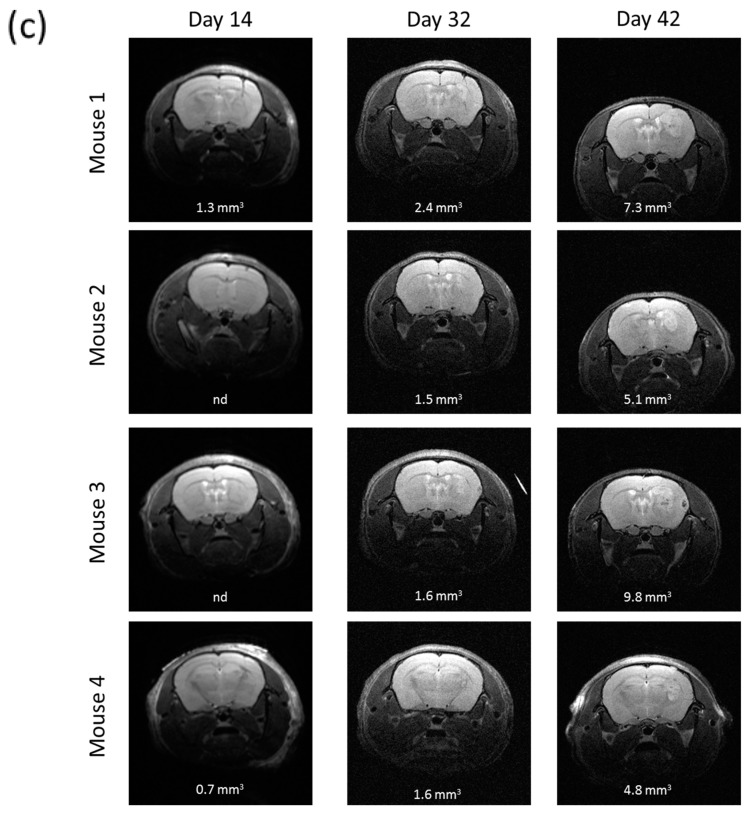
Figure 4.
In vivo tumorigenicity of R2J cells after intracranial implantation in nude mice of (a) 2 × 10⁵ cells cultivated in the monolayer (b) 2 × 10⁵ or (c) 1000 cells cultivated in spheres. MRI acquisitions were performed post implantation at the times indicated. Mice were sacrificed after the last MRI. Tumor volumes were calculated by adding each tumor x slice thickness (0.5 mm²). (a) Implantation of 2 × 10⁵ R2J monolayer cultivated cells. (b) Implantation of 2 × 10⁵ R2J sphere cells. (c) Implantation of 1000 R2J sphere cells.


