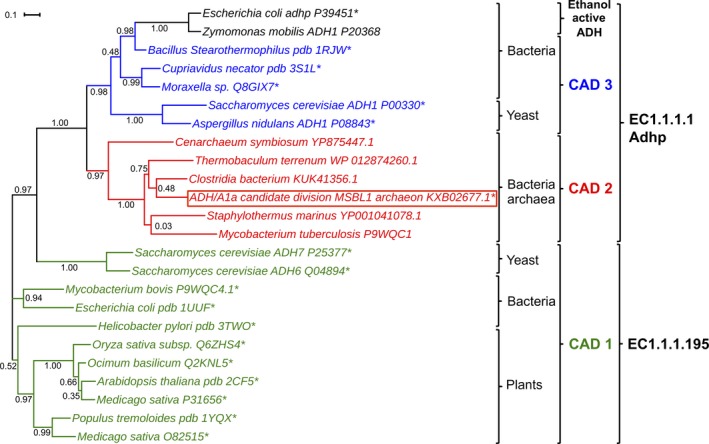
Figure 4.

Phylogenetic tree of ADH/A1a and selected ADHs of closest subfamilies. The branches are colored according to the subfamilies, which were annotated using CDD. The EC numbers indicate the functional annotation given by kegg. The calculation of the phylogenetic tree was performed using the maximum‐likelihood algorithm of FastTree2. *Experimentally characterized.
