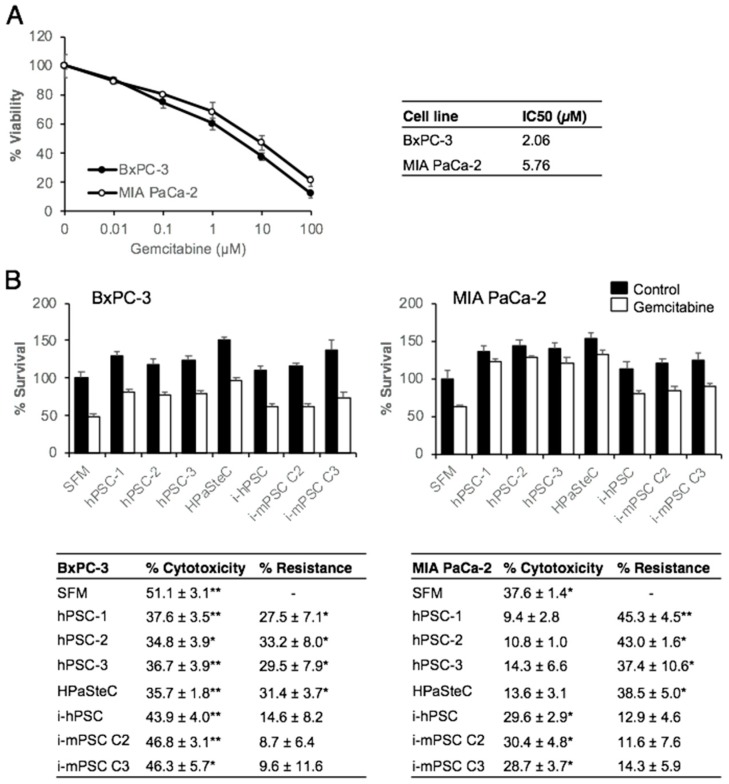
Figure 5.
Effect of PSC-CM on chemosensitivity for gemcitabine of pancreatic cancer cells. (A) Gemcitabine dose response curves: BxPC-3 and MIA PaCa-2 cells (3000 cells/well) seeded on 96-well plates were incubated with varying concentrations of gemcitabine for 48 h and evaluated for cell viability using the MTT assay. IC50 values for gemcitabine were calculated using GraphPad Prism 4.0 software. (B) BxPC-3 and MIA PaCa-2 cells were incubated with PSC-CM for 24 h prior to incubation with gemcitabine (10 μM) for 48 h. Cell viability was determined using the MTT assay. Data are mean ± SEM of triplicate determinations. The table indicates gemcitabine-induced cytotoxicity in percentage and PSC-CM-induced resistance to gemcitabine, calculated by relative reduction in cytotoxicity between SFM and PSC-CM. * p < 0.05, ** p < 0.01 comparing SFM with PSC-CM. PSC, pancreatic stellate cell; hPSC, human primary PDAC-derived PSC culture; HPaSteC, PSCs from normal human pancreas; i-hPSC, immortalized human PSCs; i-mPSC C2 and C3, immortalized mouse PSCs clone 2 and 3; PSC-CM, PSC-conditioned medium; SFM, serum-free DMEM.

