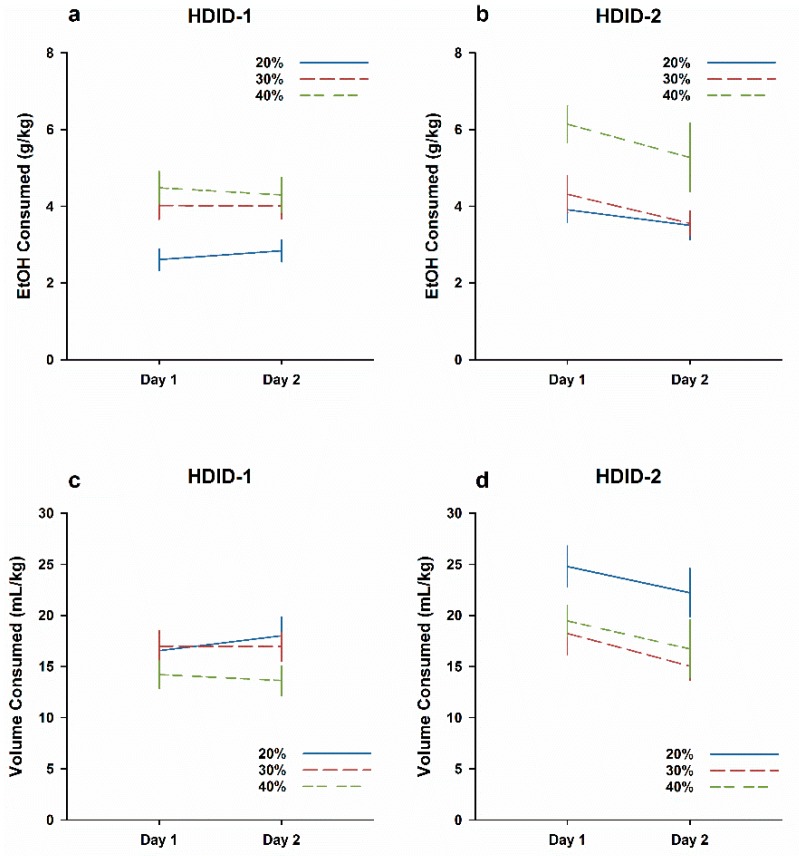
Figure 3.
HDID-2 but not HDID-1 mice show a CTA after ingesting higher EtOH concentrations. Mean ± SEM EtOH drinking during the initial 2 h each day is shown for groups of 23–24 mice per genotype and concentration, collapsed on sex. (a,b) Dose EtOH ingested in g/kg. (c,d) Volume of 20% EtOH solution consumed in mL/kg.

