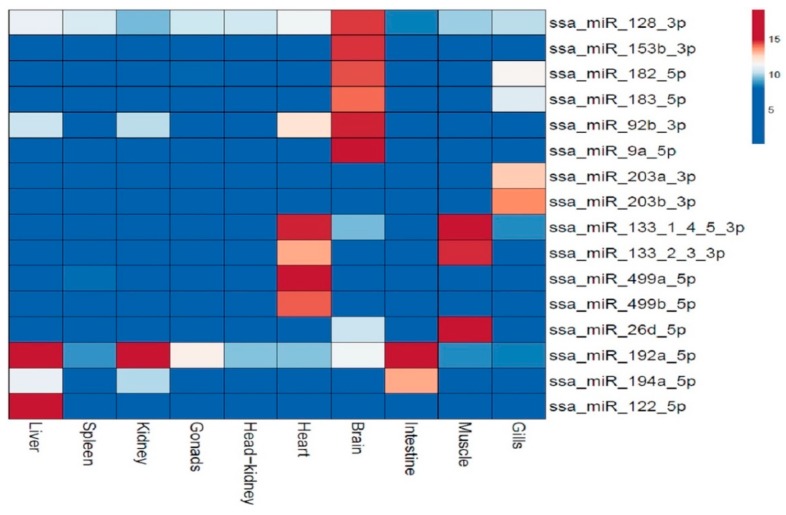
Figure 5.
The heatmap illustrates the predominant expression of 16 mature miRNAs in particular tissues. The tissues compared are given at the bottom of the columns, while the miRNAs are given in the horizontal rows to the right. Four of these miRNAs (ssa-miR-9a-5p, ssa-miR-499a-5p, ssa-miR-192a-5p and ssa-miR-122-5p) were also analyzed by RT-qPCR (see Table 2). The expression values (log2) of the miRNAs are depicted in the color scale. Very little or no expression is shown in dark blue, while other colors indicate increased expression (10–100 times) with dark red color as those with the higher expression.

