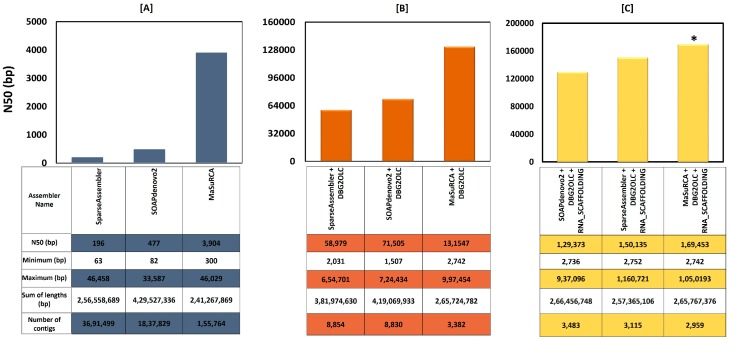
Figure 1.
Statistics of the assemblers used in our study for (A) single assembly (in blue), (B) hybrid assembly (in orange), and (C) hybrid assembly with RNA scaffolding (in yellow). The table below the bar chart shows the statistics for each of the assembler(s). The combination of assemblers marked with a star (*) was used for our analysis.

