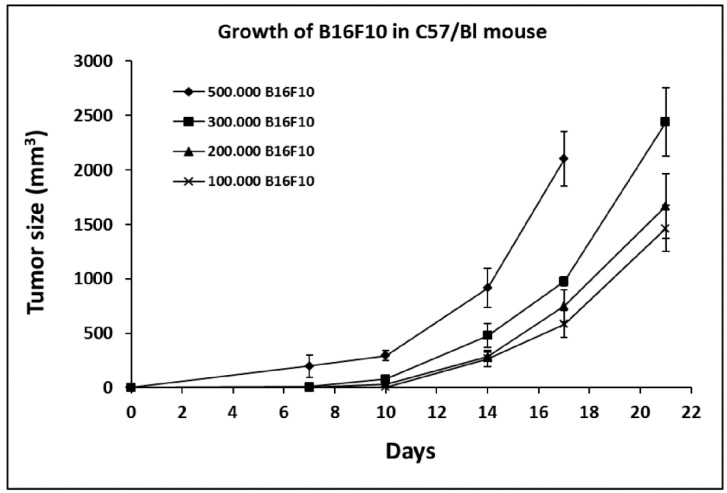
Figure 1.
Growth of B16F10 in C57/BL mice. Growth curve of B16F10 in C57/BL mice inoculated with an increasing number of B16F10 cells, respectively 100,000, 200,000, 300,000 and 500,000 cells. C57/BL mice were divided into four groups and each group consisted of five animals for statistical significance. Data are expressed as means ± SE. Tumor size is expressed in mm3.

