Figure 2.
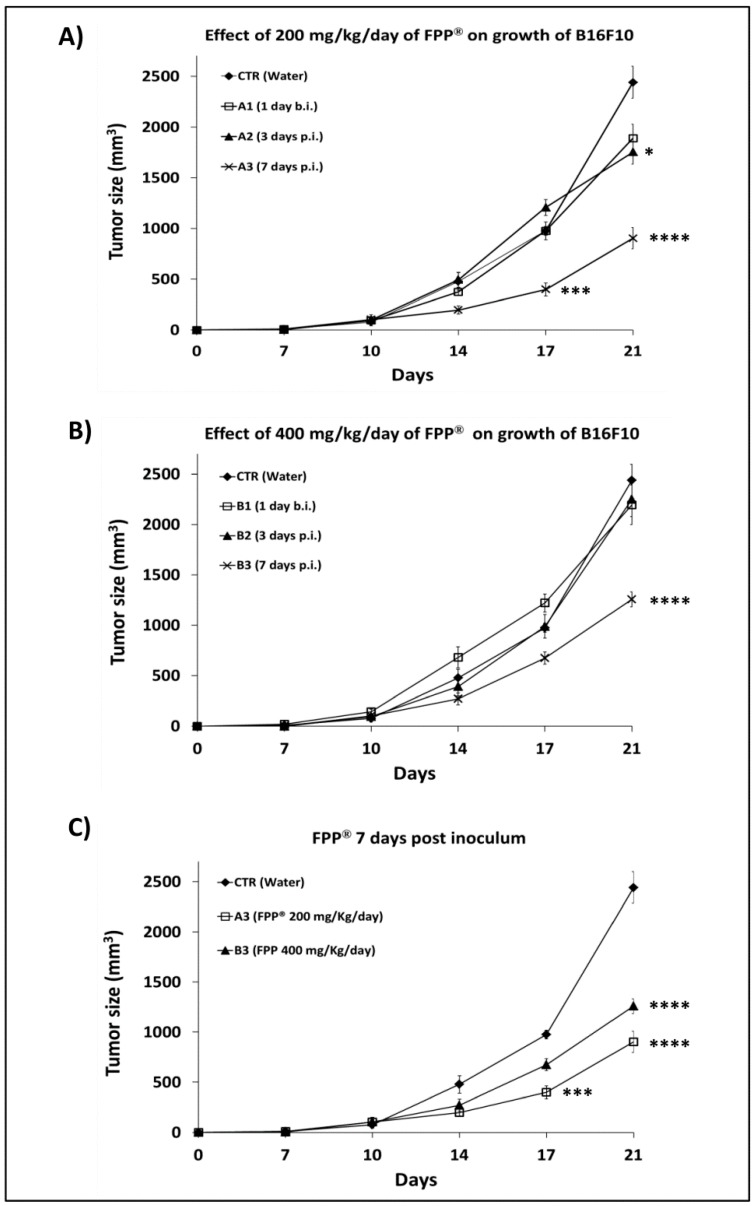
Effect of 200 mg/Kg/day and 400 mg/Kg/day of FPP® through oral gavage on growth of B16F10 in C57/BL mice. Dose-response curve of FPP® on tumor growth (mm3) in C57/BL mice treated by oral gavage with 200 mg/Kg (group A1, A2, A3) and 400 mg/Kg of FPP® (groups B1, B2, B3) every day without interruption until animal sacrifice, after 21 days from the inoculum of B16F10 cells (300000). Mice were divided into seven groups of five animals (control, A1, A2, A3, B1, B2, B3) and were treated with FPP® respectively 1 day before the inoculation of the cells (groups A1, B1), 3 (groups A2, B2) and 7 (groups A3, B3) days after the inoculation of the cells. Control group is the untreated group. (A) Effect of 200 mg/Kg/day of FPP® on growth of B16F10 in C57/BL mice (groups A1, A2, A3) until animal sacrifice. (B) Effect of 400 mg/Kg/day of FPP® on growth of B16F10 in C57/BL mice (groups B1, B2, B3) until animal sacrifice. (C) Effect of FPP® treatment 7 days post inoculum of the cells on growth of B16F10 in C57/BL mice comparing treatment with 200 mg/Kg/day of FPP® (group A3) and 400 mg/Kg/day of FPP® (group B3). Data are expressed as means ± SE. * p < 0.05, *** p < 0.0005, **** p < 0.0001.

