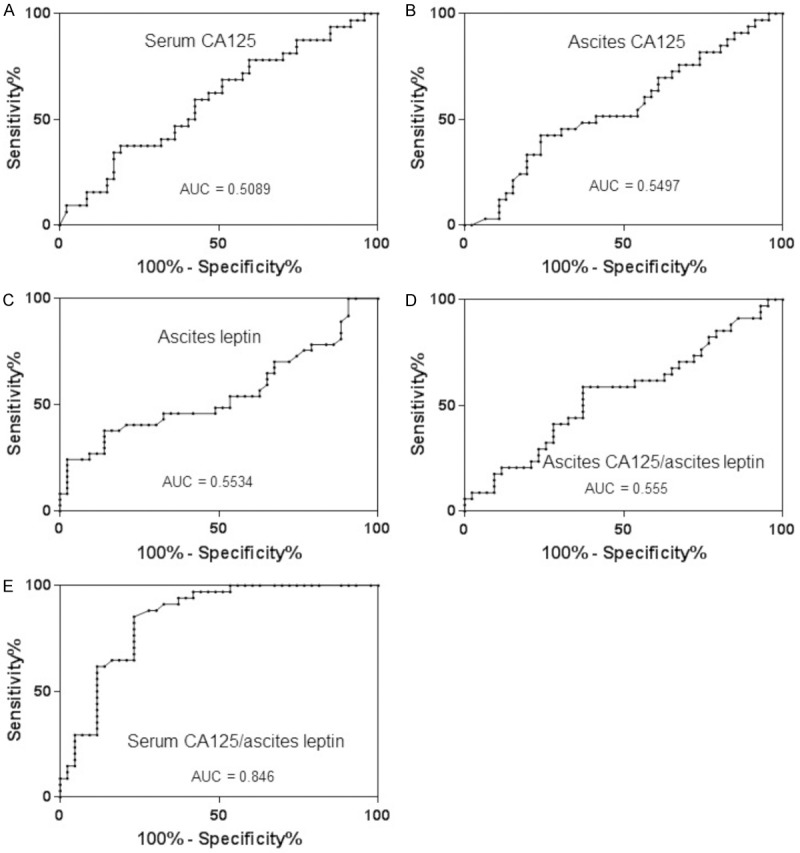
Figure 3.

ROC curves analysis and AUC values for distinguishing patients with baseline resistance to first-line therapy versus those with initially sensitive HGSOC. Serum CA125 (A), ascites CA125 (B), ascites leptin (C), ascites CA125/ascites leptin ratio (D), and serum CA125/ascites leptin ratio (E).
