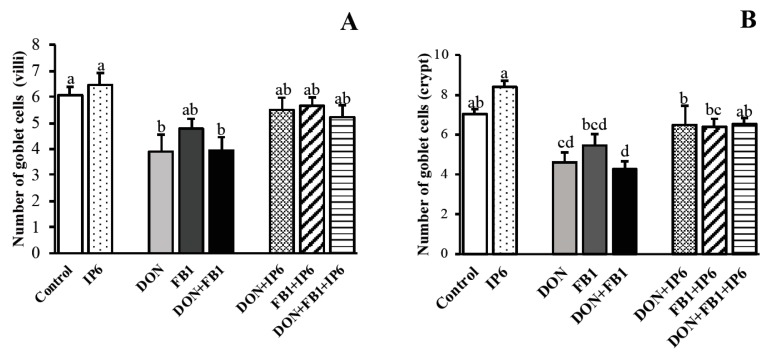
Figure 2.
Mean goblet cell density on jejunal explants. (A) Number of goblet cells on the villi of jejunal explants. (B) Number of goblet cells on the crypts of jejunal explants. Explants exposed to control treatment (□); IP6 5 mM ( ); deoxynivalenol (DON) (
 ); fumonisin B1 (FB1) (
 ); DON + FB1 (■); DON + IP6 (
 ); FB1 + IP6 (
 ); DON + FB1 + IP6 (
 ). Mean values with different superscript letters were significantly different (p ≤ 0.05).

