Figure 4.
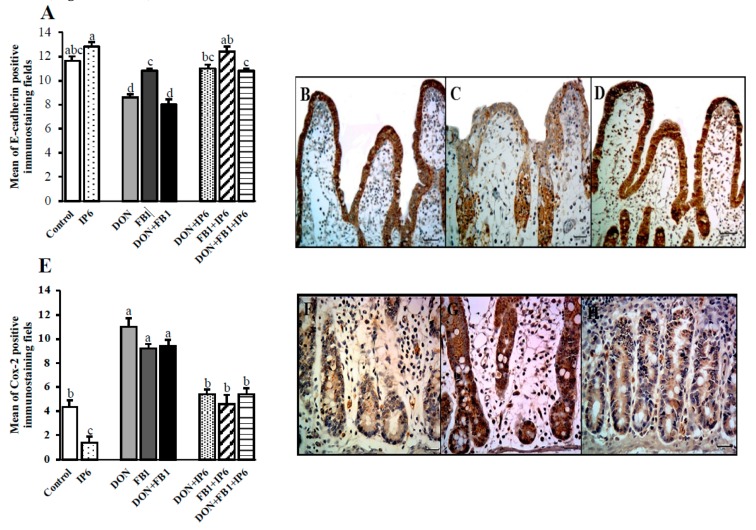
Effects of DON and FB1, alone or in association, and IP6 on E-cadherin and cox-2 expression in jejunal explants. Explants exposed to control treatment (□); IP6 5 mM ( ); deoxynivalenol (DON) (
 ); fumonisin B1 (FB1) (
 ); DON + FB1 (■); DON + IP6 (
 ); FB1 + IP6 (
 ); DON + FB1 + IP6 (
 ). (A) Mean of E-cadherin positive immunostaining per fields on explants exposed to different treatments. Mean values with different superscript letters were significantly different (p ≤ 0.05). (B) Control treatment: strong and homogeneous E-cadherin immunostaining in epithelial cells. Bar 50 µm. (C) DON 10 µM: mild and non-homogeneous E-cadherin immunostaining in epithelial cells. Bar 25 µm. (D) DON 10 µM + IP6 5 mM: strong and homogeneous E-cadherin immunostaining in epithelial cells similar to control treatment. Bar 50 µm. (B–D: immunoperoxidase method). (E) Mean of cox-2 positive immunostaining per fields on explants exposed to different treatments. Mean values with different superscript letters were significantly different (p ≤ 0.05). (F) Control treatment: mild cox-2 cytoplasmic immunostaining in crypt cells. (G) DON 10 µM: diffuse and strong cox-2 cytoplasmic immunostaining in crypt cells. (H) DON 10 µM + IP6 5 mM: decrease in cox-2 cytoplasmic immunostaining in crypt cells similar to control treatment. (F–H: immunoperoxidase method, bar 25 µm).

