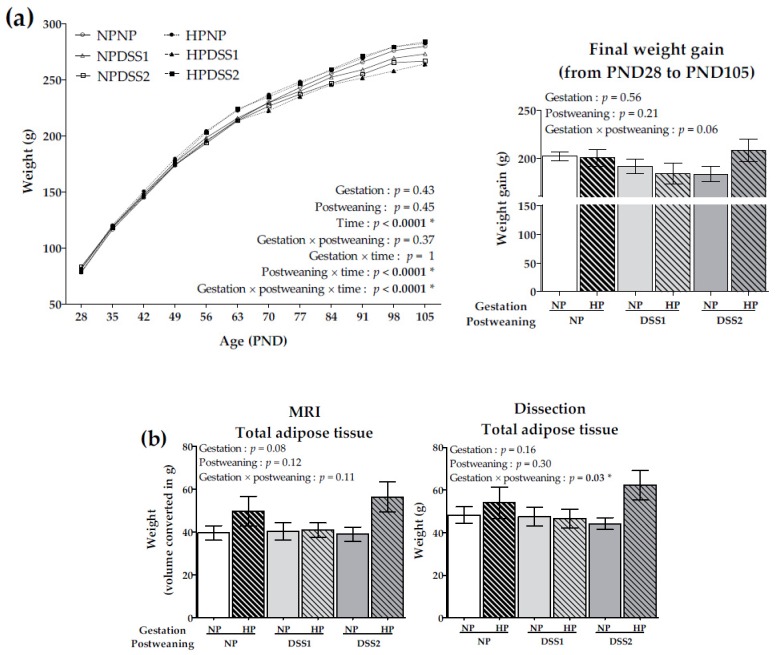
Figure 3.
Body weight during the self-selection period from PND28 to PND105 and final weight gain on PND105 (a) and total adipose tissue weights on PND105 estimated by Magnetic Resonance Imaging (MRI) and by dissection (b). Data are means ± SEMs. Effects of diets were tested within model W and Wt (*, p < 0.05). PND, Post-natal Day; NP, Normal-Protein (control); HP, High-Protein; DSS1, Dietary Self-Selection 1 (P and G/L in 2 different cups); DSS2, Dietary Self-Selection 2 (P, G and L in 3 different cups); MRI: Magnetic Resonance Imaging.

