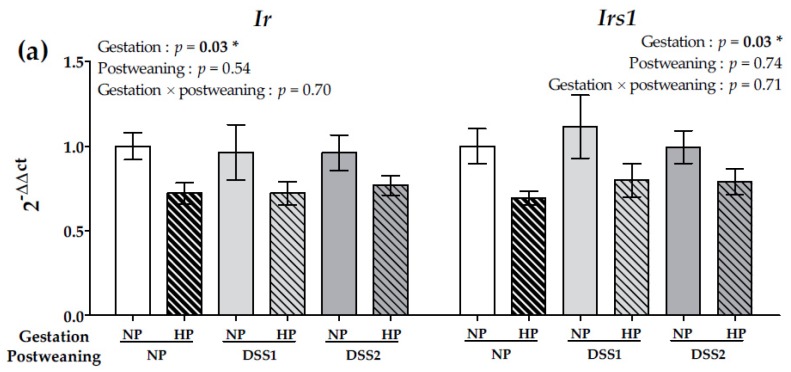
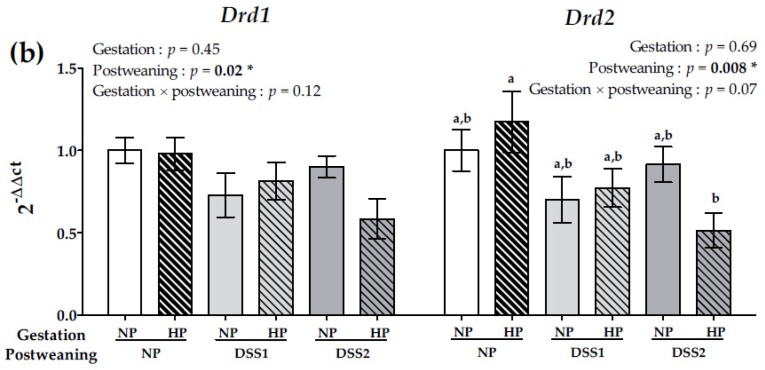
Figure 5.
Gene expression in NAcc of Drd1 and Drd2 (a) and gene expression in liver of IR and IRS1 (b) on data collected on PND105. Data are means ± SEMs. Effects of diets were tested within model W (*, p < 0.05). Means that are significantly different (p < 0.05) according to the post-hoc test have different letters (a or b). Drd1 and 2, Dopamine receptors 1 and 2; IR, Insulin receptor; IRS1, Insulin receptor substrate 1; PND, Post-natal Day; NP, Normal-Protein (control); HP, High-Protein; DSS1, Dietary Self-Selection 1 (P and G/L in 2 different cups); DSS2, Dietary Self-Selection 2 (P, G and L in 3 different cups).


