Figure 1.
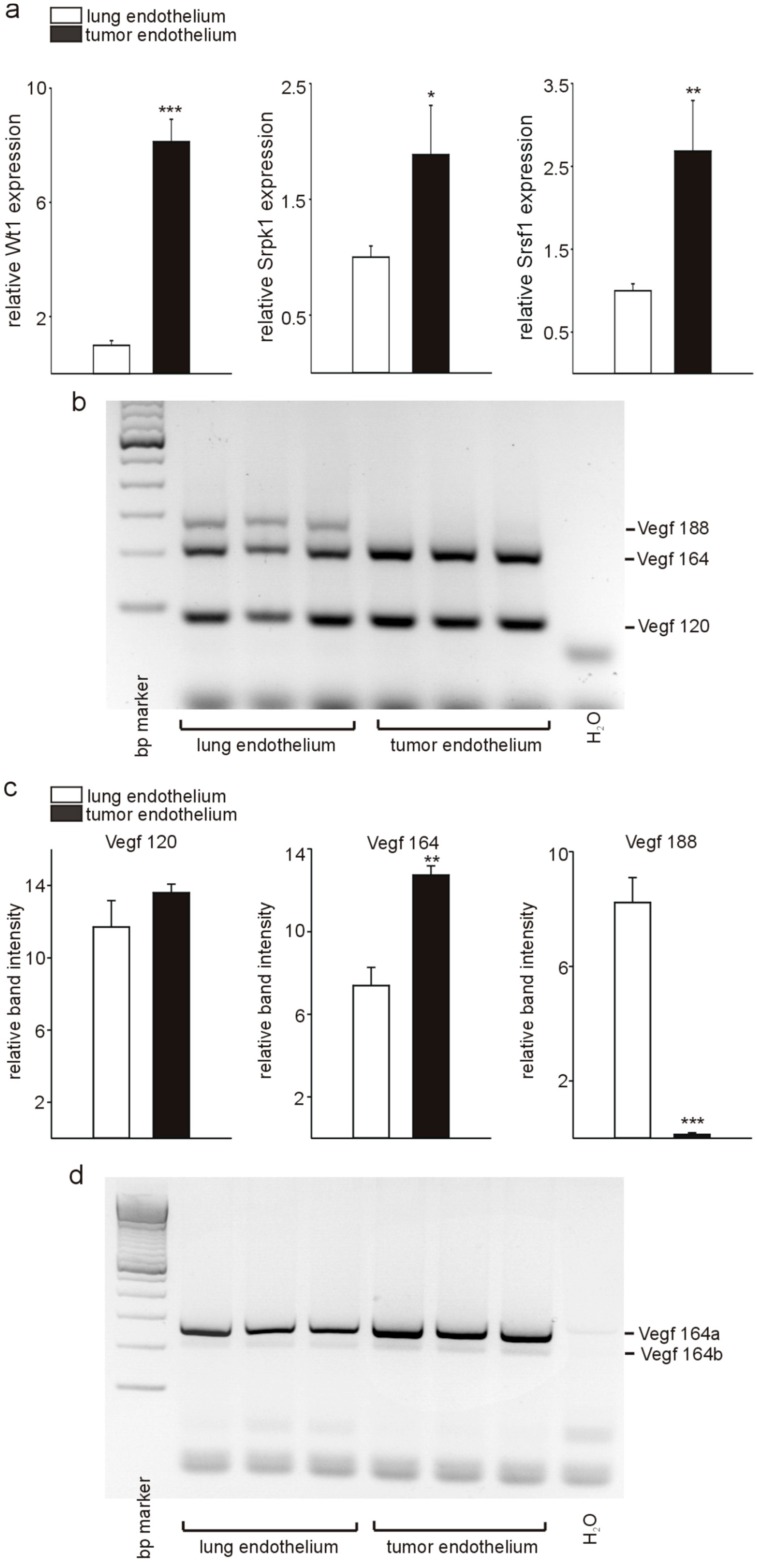
Differential expression of Wt1, Srpk1, and Srsf1, and Vegf splicing in tumor versus normal lung endothelium. (a) Quantitative RT-PCR analysis of Wt1, Srpk1, and Srsf1 expression in isolated tumor versus lung endothelial cells (n = 3 each). (b) Detection of Vegf isoforms (n = 3) was performed by RT-PCR followed by agarose gel electrophoresis as described [18]. A representative example is shown. The different molecular weight isoforms are indicated (Vegf 188: 293 bp; Vegf 164: 221 bp; Vegf 120: 89 bp). (c) Quantification of the different Vegf isoforms in isolated tumor and lung endothelial cells. (d) Detection of the Vegf 164a (281 bp) and Vegf 164b (215 bp) isoforms was performed by RT-PCR followed by agarose gel electrophoresis as reported previously [26] (n = 3). Data are expressed as means ± S.E.M. * p < 0.05, ** p < 0.01, *** p < 0.001.

