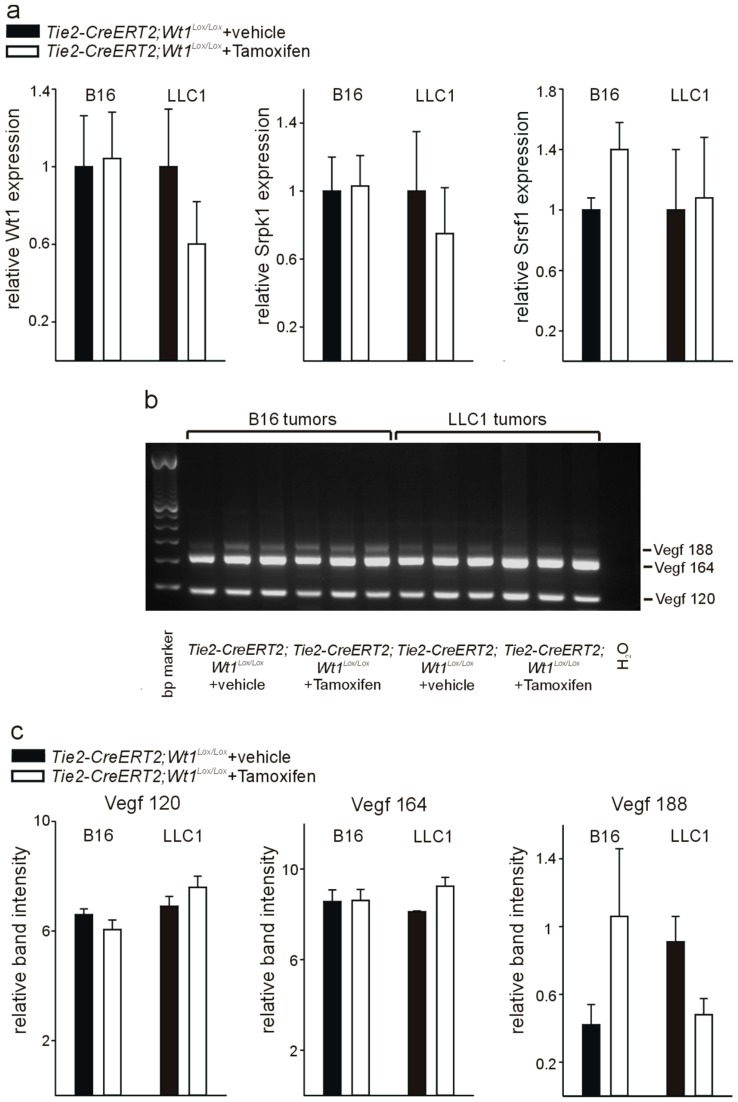
Figure 5.
Determination of Wt1, Srpk1 and Srsf1 expression and Vegf isoform distribution in whole tumor samples from Tie2-CreERT2; Wt1Lox/Lox mice treated with Tamoxifen compared to vehicle-treated controls. (a) Expression levels of Wt1, Srpk1 and Srsf1 were determined by quantitative RT-PCR on B16 and LLC1 tumor samples from Tie2-CreERT2; Wt1Lox/Lox mice treated with Tamoxifen compared to vehicle-treated controls (n = 6 each). Expression of each gene was normalized to the respective arithmetic means of Gapdh, Actnb, and Rplp0 expression. (b) Vegf isoforms (Vegf 188: 293 bp; Vegf 164: 221 bp; Vegf 120: 89 bp) were determined by PCR as described [18] in samples of B16 and LLC1 tumors isolated from Tie2-CreERT2; Wt1Lox/Lox mice treated with Tamoxifen compared to vehicle-treated controls (n = 3 each). (c) Quantification of relative band intensities for the different Vegf isoforms.

