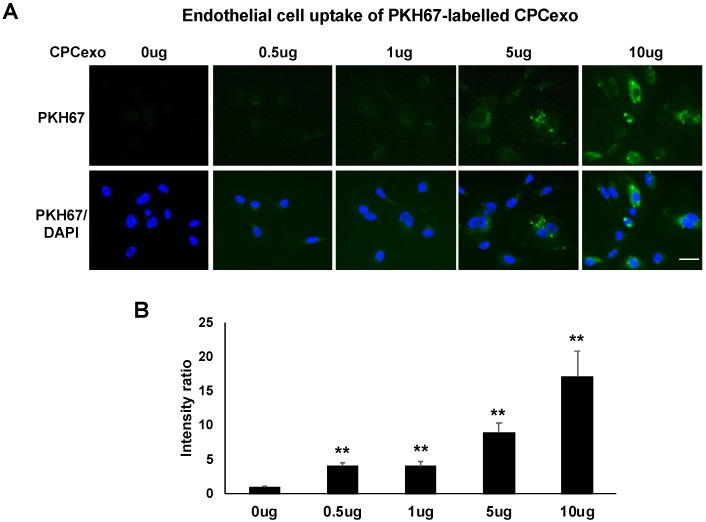
Figure 4.
Uptake of CPCexo by human ECs. (A) The fluorescence images of PKH67 (Green) labeled CPCexo added to HUVECs for 2 h at the indicated concentrations. Nuclei were stained with DAPI (Blue) to show the cell confluency. (B) Averaged fluorescence intensity of PKH67 positive CPCexo incorporated by HUVECs in a dose-dependent manner. The scale bar is 20 μm (n = 3, ** p < 0.01 (0 µg vs. each dose)).

