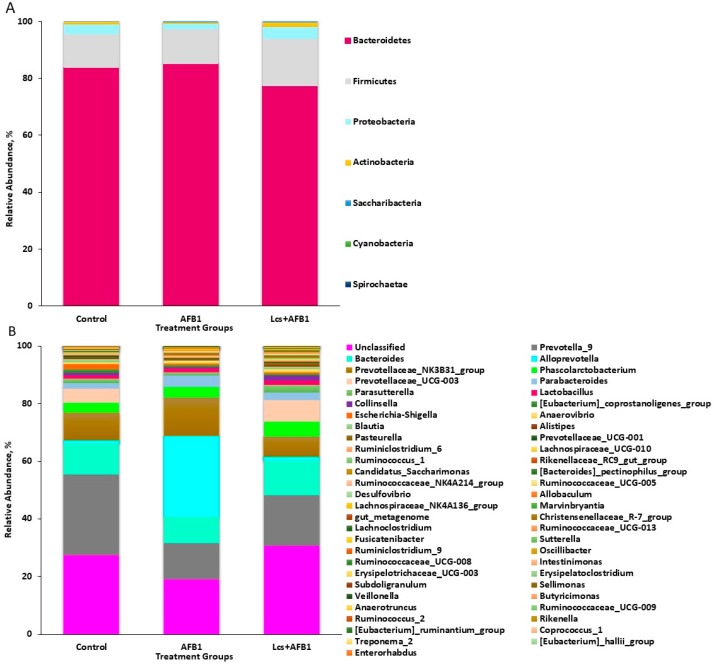
Figure 1.
Microbial taxonomic profiles from the fecal contents of the three treatment groups at the phylum (A) and genus (B) levels, classified by the representation of >1% of the total sequences. The X-axis is the sample name or group name, and the Y-axis is the relative abundance (taxon reads/total reads in the gut microbiota) of different species. The legend is the name of the taxonomic classification of the species.

