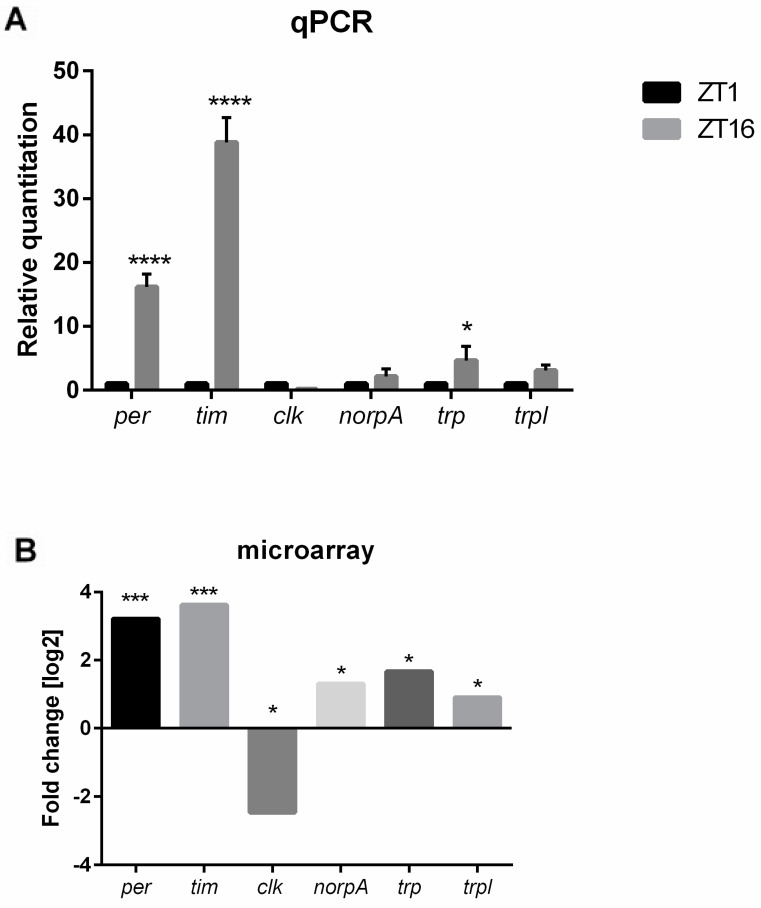
Figure 2.
The comparison of microarray and qPCR data in control flies (GMR>Valium10) between ZT1 and ZT16. (A) qPCR data normalized to ZT1 as 1, statistically significant differences are marked with asterisks: * p ≤ 0.05, **** p ≤ 0.0001; (B) in microarray, fold change is relative to ZT1. Statistically significant changes are marked with asterisks: * 0.005 < p-values < 0.05, *** p-values < 0.0005. The pattern of gene expression, which was examined using two different techniques, is similar for the following genes: per, tim, clk, norpA, trp, and trpl.

