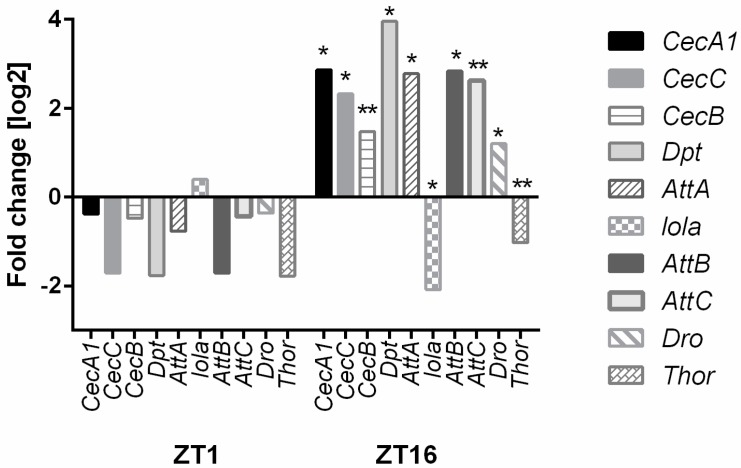
Figure 4.
Microarray data of the humoral immune response genes. Differences in the selected gene expression levels are shown between GMR>hoRNAi and GMR>Valium10 (control) at ZT1 and ZT16. Fold change is relative to the control. Statistically significant differences are marked with asterisks: * 0.005 < p-values < 0.05, ** 0.0005 < p-values < 0.005. The following genes were examined: CecA1, CecC, CecB, Dpt, AttaA, lola, AttB, AttC, Dro, and Thor.

