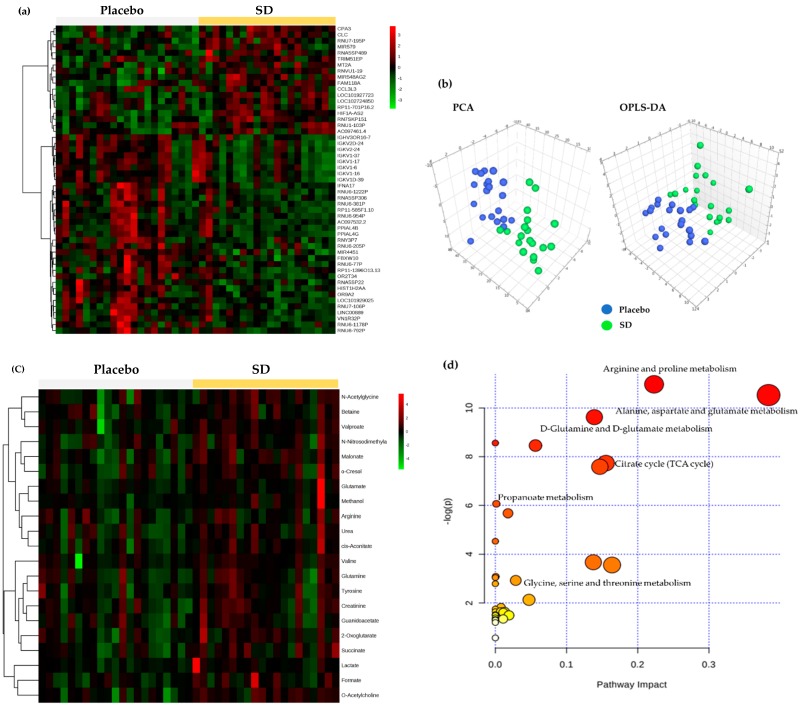
Figure 3.
Changes in the PBMC transcriptome and urinary metabolome after placebo or high-dose SD (900 mg) consumption for 4 weeks: (a) heat map visualization for the PBMC transcriptome; (b) PCA and OPLS-DA score plots derived from urinary NMR metabolites; (c) heat map visualization for the urinary 1H NMR metabolites; (d) metabolic pathway analysis overview showing altered urinary 1H NMR metabolic pathways by SD consumption. PBMC, peripheral blood mononuclear cell; SD, Sanghuang–Danshen; PCA, principal component analysis; OPLS-DA, orthogonal partial least squares-discriminant analysis; NMR, nuclear magnetic resonance.

