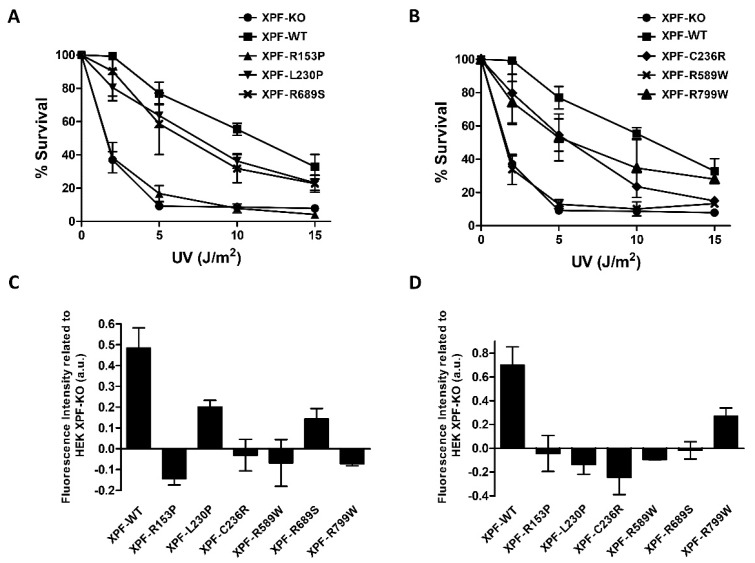
Figure 2.
(A,B) Percentage of surviving cells after increasing doses of ultraviolet (UV) irradiation. Mean of at least two independent experiments of two replicates and the standard deviation is represented in the two graphs. (C) Unscheduled DNA synthesis (UDS) assay. Fluorescence intensity is represented relative to fluorescence intensity of Human Embryonic Kidney (HEK) XPF-KO. The graph represents the mean of at least three independent experiments with SD. (D) RRS assay. Fluorescence intensity is represented relative to fluorescence intensity of HEK XPF-KO. The graph represents the mean of at least three independent experiments with SD.

