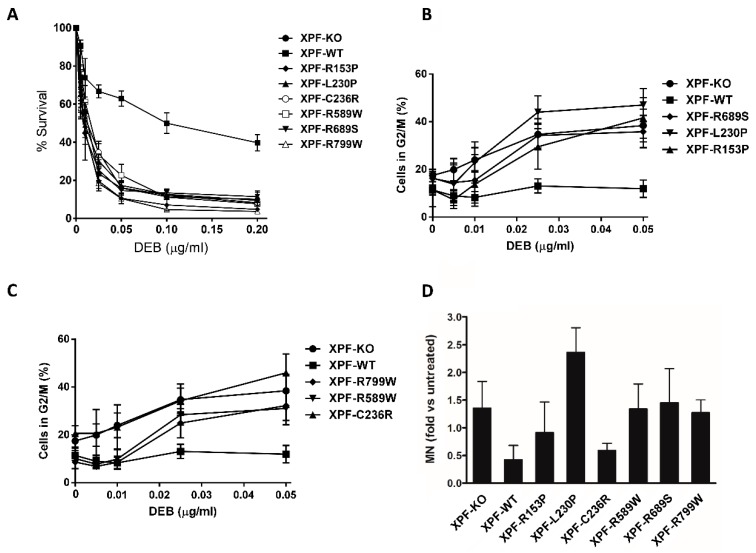
Figure 3.
(A) Percentage of surviving cells under increasing doses of diepoxybutane (DEB). The graph represents the mean of at least two independent experiments with two replicates and the SEM. (B,C) Percentage of cells stalled in G2/M phase after DEB exposition. Half of the XPF variants are represented in each graph with the positive and negative controls. Each graph represents the mean of at least two independent experiments with the SEM. (D) Micronuclei (MN) test after DEB (0.01 μg/mL) exposure. Data is represented in fold changed vs. untreated cells. Graph represents the mean of at least three independent experiments with SD.

