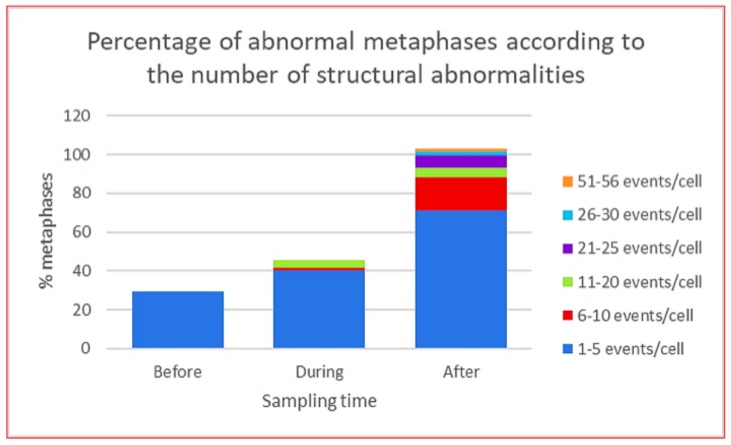
Figure 4.
Total population of abnormal metaphases in lymphocytes from HL patients at each indicated sampling time, before, during and after the stress of CT ABVD/RT. The graph shows the percentage of abnormal metaphases according to the number of structural abnormalities per cell [48].

