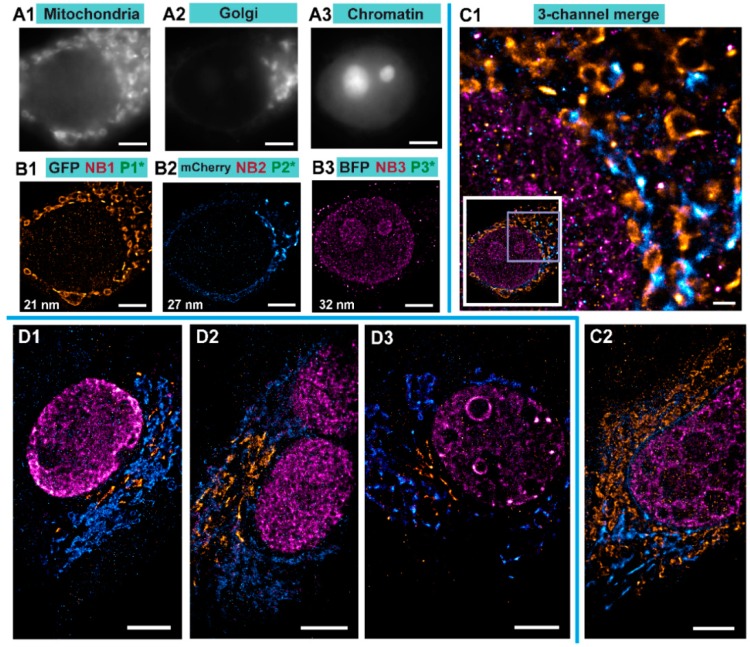
Figure 4.
Exchange PAINT imaging. A1–A3 Diffraction-limited wide-field images of individual target fluorophores: Mitochondria with TOM70-EGFP (A1), Golgi with GalNacT-mCherry (A2), Chromatin with H2B-mTagBFP (A3). (B1–B3) Single-channel super-resolution DNA-PAINT images of respective organelles. The number represents Fourier ring correlation (FRC) number for resolution for the respective image. (C1) Left bottom inset is the full view of the cell imaged in B with all 3-target Exchange PAINT images merged. Right, zoom of the boxed area I the inset. (C2) One more example of Exchange PAINT imaging with the same set of staining as in B and C. (D1–D3) Specificity controls were performed by swapping the fluorescent proteins and changing the Golgi marker. Now cells were expressing TOM70-mCherry and GM130-EGFP (a different Golgi marker). All scale bars correspond to 5 µm, except in C1 where the scale bar represents 1 µm.

