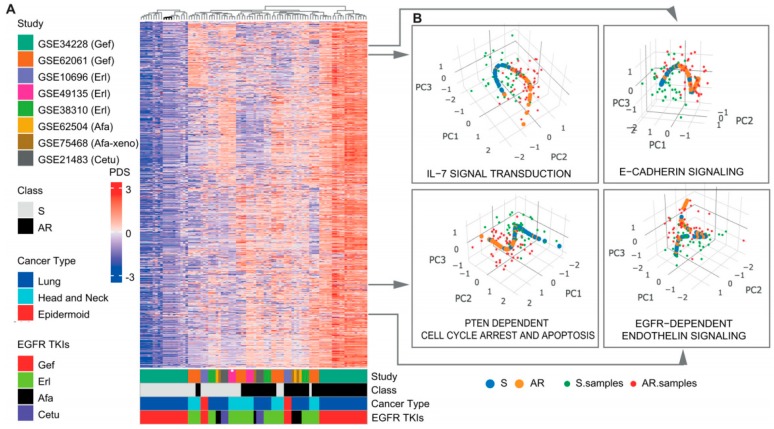
Figure 2.
Meta-analysis-derived pathway deregulation analysis. (A) Pathway dysregulation score (PDS) matrix for the 8 internal training/validation study sets. Each row represents the z-score-normalized PDS for each individual sample in each cohort. The color-bars in the bottom indicate the following from top to bottom: (1) the study cohort. (2) The resistance status of samples. (3) The cancer subtype of the samples. (4) The type of EGFR-TKI. (B) Principal curves of selected pathways. The principal curve learned for the pathways on the 8 study cohort. The data points and the principal curve are projected onto the three principal components (PCs; PC1 to PC3). The principal curve goes through the cloud of samples and is directed so that EGFR-TKI-sensitive samples are near the beginning of the curve. The acquired EGFR-TKI-resistant samples are projected onto the curve. AR, acquired resistance; S, sensitive; Gef, Gefitinib; Erl, Erlotinib; Afa, Afatinib; Cetu, Cetuximab.

