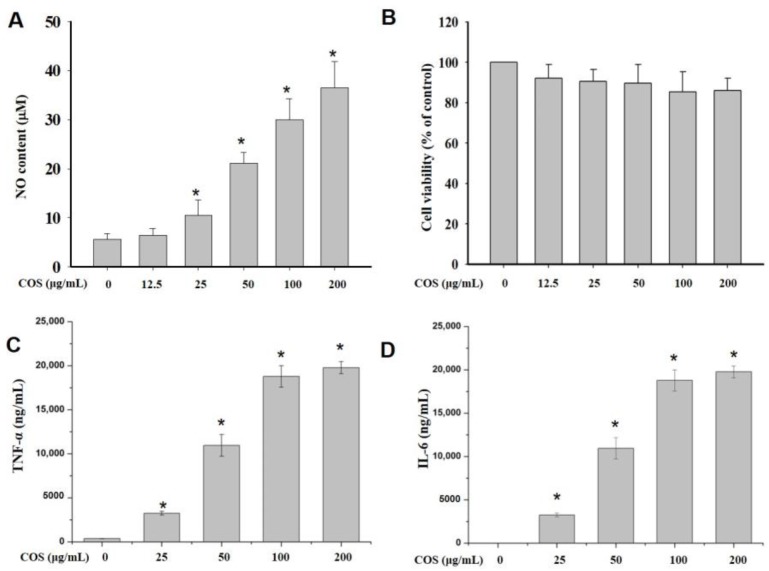
Figure 3.
The effects of chitooligosaccharides (COS) on cell viability and cytokine production. RAW 264.7 cells were treated with COS (0–200 μg/mL) for 24 h. (A) The nitric oxide production on treatment with α-COS (1874 Da). (B) The cell viability on treatment with α-COS (1874 Da). (C) The production of tumor necrosis factor-α (TNF-α) on treatment with α-COS (1874 Da). (D) The production of interleukin-6 (IL-6) on treatment with α-COS (1874 Da). The values are presented as means ± SD (n = 3). (* p < 0.05 vs. control group).

