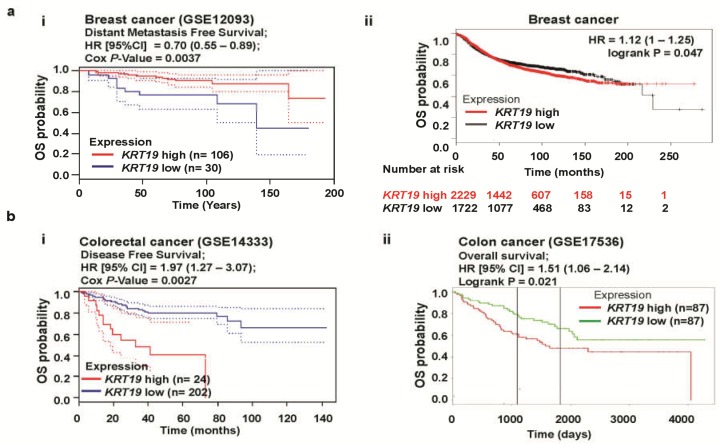
Figure 3.
Correlation of KRT19 gene expression with clinical outcomes in breast and colon cancers. (a) The survival curve comparing patients with high (red) and low (blue/black) expression in breast cancer was plotted from the PrognoScan (ai) and Kaplan Meier plotter (aii) databases. Dotted lines indicate the 95% confidence intervals for each group. Survival curve analysis was conducted using a threshold Cox p-value < 0.05. (b) Survival curve comparing a patient with high (red) and low (blue/green) expression of KRT19 in colon cancers plotted with data from the PrognoScan (bi) and PROGgeneV2 (bii) databases. Dotted lines indicate the 95% confidence intervals for each group. Survival curve analysis was conducted using a threshold Cox p-value < 0.05.

