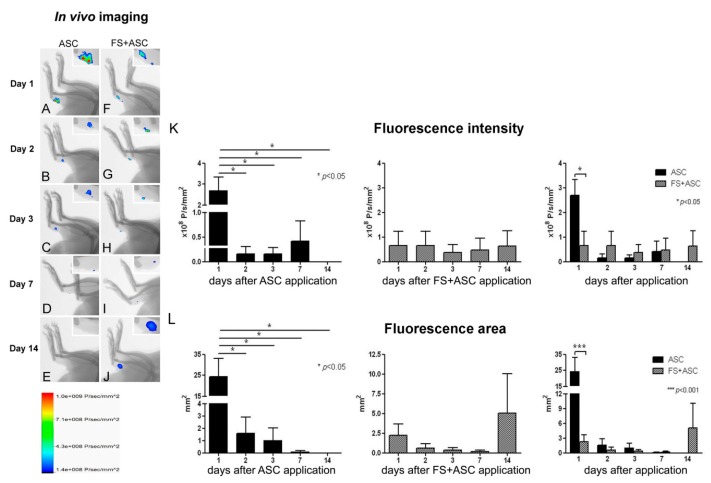
Figure 3.
(A) In vivo imaging for detection and quantification of PKH26-labeled ASC in the tendon transected region: ASC (A–E) and FS + ASC (F–J) groups were analyzed on the 1st, 2nd, 3rd, 7th,14th and 21st days after injury (n = 3). Observe the fluorescence intensity and area in the detail of each image of tendons (A–J). Scale: fluorescence intensity (×108 P/s/mm²). Fluorescence intensity (K) and fluorescence area (L) occupied by ASC after quantification of images from in vivo imaging. Significant difference represented by (*) and (***) between the ASC and FS + ASC groups.

